Tottenham youngest team in the English Premier League
At second and third position in the English Premier League ranking are Liverpool (25.5 years) and Newcastle (25.6). In contrast, the average age on the pitch is particularly high at West Bromwich Albion (29.2) and Manchester City (28.5).
The oldest teams in the other big-5 leagues are Rayo Vallecano (29.0 years), Bastia (28.6), Darmstadt (28.1) and Chievo (30.7). The average per league varies between 26.3 years in the German Bundesliga and 27.5 years in the Italian Serie A.
The French top the table of big-5 league expatriates
The most numerous contingent of French expatriates is to be found in England. Since the start of the season, 40 players from France played in the English Premier League. However, French are well represented also in Italy (28 players), Spain (27 players), and, to a lesser extent, Germany (11 players, including Kingsley Coman who also played in Serie A).
The analysis of countries with the most representatives in foreign leagues at worldwide level is available in the eighth edition of the CIES Football Observatory Monthly Report. For more information, please contact us at football.observatory@cies.ch
New study: exporting countries in world football
While Brazil is the most represented origin among foreigners both in Europe (1,137 players) and in Asia (437 players), Argentina is the main exporting country at Latin American level (511 players compared to only 124 Brazilians).
At worldwide level, the three nations with the most footballers in foreign professional and semi-professional clubs are Brazil (1,784 players), Argentina (929 players) and France (758 players). These three nationalities alone account for almost 20% of foreigners present on a global level.
No South American country is among the top five destinations of Brazilians. Conversely, three of the five main destinations of Argentineans are to be found in South America. Similarly, the main countries to which French players migrate are geographically close to the home country.
The last chapter of the study analyses four leagues in the United States, where football is undergoing considerable development. The Report shows the marked diversification of international recruitment of US clubs. It also predicts that American teams will increasingly challenge European, Asian and South American clubs in the race for new talent.
For more information or to contact the authors of the study, please write to football.observatory@cies.ch
Money League: Chelsea thirteen positions below expected ranking
Conversely, the most positive difference so far between financial and sporting ranking in the English Premier League was measured for Leicester City: +12. Claudio Ranieri’s team is in fifth position, while only three EPL clubs invested less money to assemble the squad.
In the other big-5 leagues, the teams that over-achieved the most with respect to transfer investments are Eibar (+10 positions), Angers (+17), Ingolstadt (+11) and Chievo (+8).
On the contrary, the following teams are currently ranked well below the position where their financial power should have allowed them to be: Real Sociedad (-11 positions), Marseille (-13), Stuttgart (-8) and Juventus (-11).
Best performing players: current and future stars
At the top of the absolute tables in the English Premier League are Laurent Koscielny (Arsenal) for centre backs, Cédric Soares (Southampton) for full backs, Santi Cazorla (Arsenal) for defensive midfielders, Mesut Özil (Arsenal) for attacking midfielders and Riyad Mahrez (Leicester) for forwards.
The analysis relies on data provided by OptaPro and takes into account performance in six key areas of the game: rigour, recovery, distribution, take on, chance creation and shooting. A detailed presentation of the exclusive approach developed by the CIES Football Observatory research team is available in issue number 5 of the Monthly Report.
According to this approach, the best performing U21 footballers in the English Premier League so far have been Chancel Mbemba (Newcastle) for centre backs, Jordan Amavi (Aston Villa) for full backs, Emre Can (Liverpool) for defensive midfielders, Nathan Redmond (Norwich) for attacking midfielders and Raheem Sterling (Manchester City) for forwards.
The top 15 list per league and position is updated on a weekly basis on the CIES Football Observatory website. More information is available at football.observatory@cies.ch.
Mapping transfer fees in football: who got the money?
Clubs participating in the Champions League are over-represented in the top positions of the ranking of clubs having generated the most incomes in transferring players to other teams. Among the 15 top ranked clubs, only Monaco, Liverpool and Aston Villa did not qualify for the group stage of the 2015/16 Champions League. This finding shows the key importance to obtain top level results to be able to transfer players for significant amounts of money.
However, the majority of clubs having generated the most incomes on the transfer market are also among teams who invested the most for new signings (see issue number 118 of the CIES Football Observatory Big-5 Weekly Post). Consequently, among the 15 clubs with the most positive net transfer spend, only Wolfsburg and Sevilla take part in the group stage of the current Champions League edition.
Among the 15 clubs with the most negative net transfer spend, we find some of the wealthiest European clubs (Manchester City, Paris St-Germain, Manchester United, Real Madrid, etc.), as well as not-so-rich teams who heavily invested on the transfer market in the hope of improving results, such as Milan AC, Newcastle United, West Bromwich Albion, Bologna, Sunderland and Crystal Palace.
Record high: more than 3 billion € invested on new players
On average, during the last three summer transfer windows (2013-2015), the transfer expenditure of big-5 league clubs was 68% greater than in the three previous ones (2010-2012). The biggest increase was recorded at English Premier League level: +98%.
Manchester City tops the table for summer 2015 with a transfer expenditure of 230 million €, ahead of Manchester United (189 million €) and Juventus (137 million €). The transfer expenditure of English clubs (1.35 billion €, new record high) accounted for 41% of total big-5 league investments.
Manchester City also heads the ranking of transfer fees invested since July 2010: 784 million €. In second and third position are two other English clubs: Chelsea (711 million €) and Manchester United (640 million €). The first non-English club is French side Paris St-Germain (615 million €).
From Martial to Sterling: most over- and under-paid players
On average, big-5 league players transferred for money during last summer were paid 23% more than footballers with similar characteristics transferred during the five previous years. If we add this percentage to the transfer values estimated by the CIES Football Observatory at the end of the 2014/15 season on the basis of its exclusive econometric model, we obtain figures taking inflation into account.
The comparison of these values with fees paid by clubs allows us to assess transfers from an economic perspective. This analysis is carried out without considering add-on fees related to the future performance of players, nor sell-on fees negotiated on future transfers. Players on loan with buy-out clauses were not included.
This study indicates that the most under-paid player in absolute terms with respect to the sums invested in the recent past for footballers with similar characteristics was Anthony Martial by Manchester United (+27.9 million €, not including add-ons), followed by Kevin de Bruyne by Manchester City (+26.6 million €) and Christian Benteke by Liverpool (+19.6 million €).
At the opposite end of the table, the most under-paid players according to the CIES Football Observatory analysis were Raheem Sterling by Manchester City (-32.1 million €), Mapou Yanga-Mbiwa by Olympique Lyonnais (-11.9 million €) and Robin van Persie by Fenerbahçe (-11.4 million €).
More information is available on the CIES Football Observatory website or on request at football.observatory@cies.ch. For a detailed presentation of the methodology used to estimate the transfer value of players, please refer to issue number 6 of the CIES Football Observatory Monthly Report.
Who will win the big-5 league titles?
In total, big-5 league teams have spent a record figure of 9.3 billion euro to sign current squad members. The gaps between clubs are tremendous: from 587 million for Real Madrid to less than one million for Carpi, Frosinone, GFCO Ajaccio, Rayo Vallecano and Sporting Gijón.
From the perspective of transfer market investments, one would expect that Real Madrid, Manchester City, Paris St-Germain, Bayern Munich and Juventus win the title in their respective leagues. Conversely, at English Premier League level, Bournemouth, Watford and Norwich should face relegation just one year after promotion.
For a detailed analysis of the link between transfer expenditure and success, refer to issue number 3 of the CIES Football Observatory Monthly Report.
The CIES Football Observatory unveils its updated approach for sustainable success
Since 2005, the Football Observatory research group within the International Centre for Sports Studies (CIES) has developed pioneering data analysis to understand the logics of success in football. This report unveils the key findings related to the four main dimensions of sustainable squad management: team chemistry, demographic structure, performance analysis and transfer policy.
Professional clubs, football academies and leagues regularly take advantage of the exclusive expertise gathered within the CIES Football Observatory to increase their competitiveness. The innovative research work carried out also has an educational vocation by helping football stakeholders, including media and fans, to develop original thinking on the beautiful game.
Furthermore, the CIES Football Observatory academic team is pleased to disclose its player performance rankings for the five major European championships. The top 15 list per position and league will be updated on a weekly basis throughout the season. To know more about the methodology used, see Monthly Report number 5.
For more information, please contact us at football.observatory@cies.ch.
Record high of expatriates in the best ranked teams
During last season, the percentage of minutes played by club-trained footballers reached a new record low: 14.3%. In the English Premier League, players who spent at least three years between the ages of 15 and 21 in their employer club never played a fewer percentage of minutes than in 2014/15: 10.2%. The minimal level of minutes played by club-trained footballers was recorded in Italy: 8.5%.
The percentage of minutes played by expatriates is stable at around 46%. However, the percentage of players who grew up in a different country than that of their employer club reached a new record high among the five best ranked teams per league: 59.6%. This percentage was never as high as in 2014/15 in three leagues out of five: England (77.1%), Spain (57.1%) and Germany (53.1%). It is also very high in the Italian Serie A: 71.4%.
Transfer value: Messi, the 280 million euro man
The CIES Football Observatory is also proud to be able to present for the first time the probabilities of fee paying transfers for big-5 league players. This was a major achievement of the research work carried out by our academic team during the last year. Many expensive footballers are to be found in the top-100 of this ranking, such as Raheem Sterling, Alexis Sánchez, Antoine Griezmann, Harry Kane and Philippe Coutinho.
More information is available in issue number 115 of the Big-5 Weekly Post (the last before the summer break). The full data is presented in the sixth edition of the CIES Football Observatory Monthly Report. This publication also explains the unique methodology developed by our research team to estimate both transfer values and transfer probabilities of football players.
Assessment of the big-5 league predictions
U21 players: Premier League at the bottom of the table
The clubs per league having the most relied on U21 players are Monaco (34.6%), Valencia (25.5%), Empoli (23.3%), Bayer Leverkusen (23.1%) and Liverpool (19.8%). Conversely, U21 footballers played less than 2% of minutes in 27 teams out of 98, including at Champions League finalists Barcelona and Juventus.
All the data is available in issue number 113 of the CIES Football Observatory Weekly Post.
Performance analysis : best clubs and players of the season
For more information, please contact us at football.observatory@cies.ch.
The power of youth: age of first-team inclusion
Best performing U23 players: Phil Jones & Co
At the head of the tables per position are Phil Jones (Manchester United) for centre backs, Layvin Kurzawa (Monaco) for full backs, Marco Verratti (Paris St-Germain) for defensive midfielders, Isco Alarcón (Real Madrid) for attacking midfielders and Felipe Anderson (Lazio) for forwards.
In the top-3 positions of the rankings are not only well known players such as Raphaël Varane (Real Madrid), David Alaba (Bayern Munich) or Paul Pogba (Juventus), but also less renowned talents such as José Giménez (Atlético Madrid), Ricardo Rodríguez (Wolfsburg), Granit Xhaka (Borussia Mönchengladbach), Bernardo Silva (Monaco) and Clinton N’Jie (Lyon).
The rankings are based on the CIES Football Observatory exclusive Key performance indicators in the following areas of the game:
- Shooting: ability to take advantage of goal opportunities through accurate shooting.
- Chance creation: ability to put teammates in a favourable position to strike.
- Take on: ability to create dangerous situations by successfully challenging opponents.
- Distribution: ability to keep a hold on the game through efficient passing.
- Recovery: ability to minimise goal opportunities for opponents through proficient interception work.
- Rigour: ability to minimise goal opportunities for opponents through robust duelling.
Competitive balance: best teams more dominant than ever
Teams of the moment: Borussia Dortmund tops the table
New Monthly Report: who will win the Champions League?
Player development: the big-5 leagues in a dependant situation
Players of the moment: Messi top, Ronaldo down
Big-5 Weekly Post on full internationals
New Monthly Report: transfer expenditure and results
The evolution noted for the five major European leagues since 2009/10 reflects a strong increase in the sums invested in transfer fees. While the 98 big-5 league teams spent €6.9 billion to recruit players present in their squad in 2009/10 (€70.4 million per club), this figure increased to €8.6 billion in 2014/15 (€87.7 million per club). In six seasons, the average “cost” of a squad from a transfer expenditure perspective increased by 24.5%.
Between 2009 and 2014, the fees invested in signing squad members increased particularly in the English Premier League: €2.43 to €3.43 billion (€171 million per club). The amount spent by Premier League clubs in comparison with the total for the big-5 leagues went from 35% in 2009/10 to 40% in 2014/15. The explosion of revenues from the sale of TV-rights for the period 2016-2019 will undoubtedly reinforce this process.
The minimum threshold of investments in transfer fees above which it is reasonable to expect a podium finish has strongly increased. At big-5 level, the clubs having ranked in the top three places in the 2009/10 season spent on average €189 million in signing squad members. This figure has never been as high as in the current season: €278 million (+47%). Issue number 103 of the CIES Football Observatory Big-Weekly Post also presents the data by position.
The analysis of the recipients of sums invested by big-5 league clubs in signing squad members shows that the redistributive power of the transfer market is limited. Between 2009/10 and 2014/15, 67% of transfer fees were paid out to other teams participating in the five major European championships. A record figure was incidentally measured for the last two transfer windows: 70.5%.
With a view to equality and a wish to improve competitive balance, it would be therefore useful to consider what reforms are necessary to the transfer system so as to promote solidarity. An efficient measure would be to entitle each team in which a player has passed through to a compensation for each fee paying transfer taking place over the course of the player’s professional career on a pro rata basis to the number of official matches played at the club.
We kindly invite you to read the Report to know more about this proposal.
Most profitable youth academies: Southampton tops the table
At league level, current French Ligue 1 clubs generated the most transfer fees for youth academy players (292 million €). At the bottom end of the table is Italian Serie A. This finding reflects the low level of club-trained players in Italian top division clubs (see here).
Fees received by Southampton for the transfer of Adam Lallana, Luke Shaw and Calum Chambers represent almost 40% of the total incomes of current Premier League clubs for the transfer of club-trained footballers during the last three seasons.
Southampton is an outstanding example of how youth training can constitute a key competitive advantage both sportingly and economically even in the richest league of the world.
Luis Suárez among the best signings of the season
At the head of the other rankings are Dejan Lovren (Liverpool) for rigour, Walter Gargano (Napoli) for recovery, Xabi Alonso (Bayern Munich) for distribution, Karim Bellarabi (Bayer Leverkusen) for take on and Diego Costa (Chelsea) for shooting.
The following big-5 league rookies are to be found in the top 12 positions for five out of the six areas of play taken into account:
Rigour
- Michael Keane (Burnley)
- Sergi Gómez (Celta de Vigo)
- Emiliano Velázquez (Getafe)
- Jin-Su Kim (Hoffenheim)
- Nicolás Otamendi (Valencia)
- Giancarlo González (Palermo)
- Marcos Rojo (Manchester United)
Recovery
- Wendell Nascimento (Bayer Leverkusen)
- Yeltsin Tejeda (Evian)
- Daley Blind (Manchester United)
Take on
- Sadio Mané (Southampton)
- Lucas Vázquez (Espanyol)
Chance creation
- Valentin Stocker (Hertha Berlin)
- Dušan Tadi? (Southampton)
Shooting
- Luciano Vietto (Villarreal)
- Federico Piovaccari (Eibar)
- Diafra Sakho (West Ham)
Please refer to this paper if you want to know more about the exclusive approach of the CIES Football Observatory for sustainable success.
Ajax tops the European list of the most training orientated clubs
At the head of the table is Ajax Amsterdam. The Dutch team has trained 77 players employed by the 468 teams of the 31 leagues included in the analysis. At second and third place are Partizan Belgrade (74 players) and Barcelona (57). This data confirms the outstanding know-how of these clubs in the training of youth players.
France is the most represented national association in the top 100 positions of the table: 15 clubs. This is seven more than the second and third most represented countries: Spain and the Netherlands. Conversely, there are no Turkish, Cypriot, Romanian and Norwegian teams in the top 100.
If you want to know more about the European football players’ labour market, you are kindly invited to consult our online Digital Atlas. Thank you for your interest!
CIES Football Observatory Monthly Report: tomorrow’s stars
Thanks to this analysis we are able to highlight not only well-known players such as Luke Shaw, Raheem Sterling, Romelu Lukaku or Thibaut Courtois, but also footballers not yet taking part in the big-5 leagues but of whom we will surely hear much about in the future such as, among others, Tonny Vilhena, Jetro Willems, Pione Sisto or Georgi Milanov.
The notion of experience capital refers to games played in adult championships up until 23 years of age. We attribute different values to matches according to an exclusive classification method that takes into account the performance of national association representatives in European club competitions, the division of the employer club in the domestic league and results achieved for matches played.
The method of experience capital allows clubs to optimise their approach regarding transfers by considerably reducing the risks inherent in such operations, from both the sporting and economic point of view. Our research team is at the service of clubs interested in finding out more about the practical modalities of implementing a talent spotting system of this kind.
The report also emphasises the crucial role of leagues outside the big-5 in the career development of players. Among footballers aged 23 or over currently under contract with big-5 league clubs, only 12% have always played in teams taking part in the top European championships between the start of the professional career and their 23rd birthday.
Issue number 99 of the Big-5 Weekly Post presents the highest capital experience values for U20, U21, U22 and U23 players for both the five major European championships and the remaining 26 leagues surveyed.
CIES Football Observatory exclusive transfer analysis
Buy-out clauses or options to buy existed for the five most over-paid players. This certainly helped the seller teams in the negotiations: Villarreal for Gabriel Paulista, Swansea for Wilfried Bony and Fiorentina for Juan Cuadrado.
The top level performances of Bernardo Silva and Ryan Bertrand explain the activation of the option to buy by Monaco, respectively Southampton. However, the current value of these players is well below the price paid.
Monaco and Southampton accepted to over-pay by considering the opportunities of development for the players concerned. This holds also true for Arsenal with regard to the signing of Gabriel Paulista. The three players have indeed the concrete possibility to become pillars of their national A-teams in the near future.
The cases of Wilfried Bony and Juan Cuadrado are different as they are already well established full internationals. They were primarily recruited within the context of the race for the Premier League title.
While Chelsea was also able to transfer other players – André Schürrle and Ryan Bertrand – at a higher price than expected, Manchester City was not able to do so. Chelsea could probably have got more from the permanent move of Fernando Torres. Nevertheless, his permanent move allowed the London club to save money for his salary.
The over-representation of deals between Italian clubs among the most under-paid transfers – Manolo Gabbiadini, Alfred Duncan, Daniele Gastaldello, Luca Antonelli and Gabriel Paletta – reflects the deep economic crisis of professional football in the country.
Fore more information, please contact us at football.observatory@cies.ch
Best performing U23 players: from Gímenez to Neymar
At the top of the rankings per area of the game are José Gímenez (Atlético Madrid) for rigour, Layvin Kurzawa (Monaco) for recovery, Marco Verratti (Paris St-Germain) for distribution, Alex Oxlade-Chamberlain (Arsenal) for take on, Isco Alarcón (Real Madrid) for chance creation and Neymar Júnior (Barcelona) for shooting.
Only two players are in the top 12 positions in three different rankings: Paulo Dybala (Palermo) for take on, chance creation and shooting, as well as Paul Pogba (Juventus) for distribution, take on and shooting. The following players are in the top 12 in two areas of the game:
- José Gímenez (Atlético Madrid)
- Marquinhos Aoás (Paris St-Germain)
- Phil Jones (Manchester United)
- Layvin Kurzawa (Monaco)
- Marc Stendera (Eintracht Frankfurt)
- Marco Verratti (Paris St-Germain)
- Lucas Moura (Paris St-Germain)
- Isco Alarcón (Real Madrid)
- Koke Resurreción (Atlético Madrid)
- Raheem Sterling (Liverpool)
- Nabil Fekir (Olympique Lyonnais)
- Paul-Georges Ntep (Stade Rennais)
- Neymar Júnior (Barcelona)
The full tables are to be found here. More information is available at football.observatory@cies.ch
CIES Football Observatory Key Performance Indicators (KPIs)
- Shooting: ability to take advantage of goal opportunities through accurate shooting
- Chance creation: ability to put teammates in a good position to score
- Take on: ability to create dangerous situations by successfully challenging opponents
- Distribution: ability to keep a hold on the game through efficient passing
- Recovery: ability to minimise goal opportunities for opponents through proficient interception work
- Rigour: ability to minimise goal opportunities for opponents through robust duelling
Spanish clubs outrank rivals in shooting efficiency
The top ranked teams in the remaining big-5 leagues are Olympique Lyonnais (6.7 shots per goal, 5th place), Eintracht Frankfurt (6.9, 7th), Chelsea (7.0, 10th) and Palermo (7.5, 12th).
Conversely, at the bottom end of the table are Hambourg (22.9), Aston Villa (20.9), Torino (17.1), Granada (16.9) and LOSC Lille (15.2). These figures both reflect a lack of efficiency and the difficulty in taking up a favourable position to shoot. As a matter of example, Aston Villa scored only two goals out of 109 attempts in second halves!
All these statistics were calculated from data provided by our partners Opta Pro. They are to be found here.
Real Madrid heads the table for the percentage of time leading
Juventus also led for a majority of domestic league minutes (52.0%). This figure was below 40% for Paris St-Germain (39.8%), Barcelona (39.6%) and Manchester City 38.8%). The record low at big-5 league level was recorded for Sunderland (10.3%). This does not augur well for the Black Cats.
The figures for the 98 big-5 league clubs are to be found here.
First Monthly Report: club instability and its consequences
The report indicates that stability gives clubs a competitive advantage over rival teams, be it on a sporting level (better medium and long-term results) or an economic one (a greater capacity to launch careers of club-trained players and generating revenues through their transfer).
Stability indicators such as the average length of stay of players in their club or the percentage of new signings in the squad thus show their true worth when judging the pertinence of management strategies instigated by club managers.
Well-informed fans of the most unstable teams have good reason to be anxious. In order to protect football from the bad practices of certain managers, to promote training and to increase team competitiveness, it would thus be timely to consider the introduction of a limitation on the number of transfers allowed.
True to its reputation, our research group is at the disposal of football stakeholders to analyse such a scenario. This would notably be about defining more precisely the boundaries of such a limitation on transfers in order to attain the desired goals, without interfering with the free movement of players or provoking a distortion of the market with regard to the upholding of the principle of proportionality.
Issue number 94 of the Big-5 Weekly Post also deals with the subject of club stability by presenting the date of arrival of current squad members for clubs ranked in first and last position in the table of their respective league. This analysis also allows us to highlight the importance of squad stability for sustainable success.
Top transfer values: Messi outranks Ronaldo and Hazard
With the exception of Raheem Sterling, in the top 10 positions of the ranking are only players under contract with teams that are still competing in the Champions League:
- Lionel Messi (Barcelona) : 220 million €
- Cristiano Ronaldo (Real Madrid) : 133 million €
- Eden Hazard (Chelsea) : 99 million €
- Diego Costa (Chelsea) : 84 million €
- Paul Pogba (Juventus) : 72 million €
- Sergio Agüero (Manchester City) : 65 million €
- Raheem Sterling (Liverpool) : 63 million €
- Francesc Fàbregas (Chelsea) : 62 million €
- Alexis Sánchez (Arsenal) : 61 million €
- Gareth Bale (Real Madrid) : 60 million €
The club with the most representatives in the top 100 of the table is Spanish giant and Champions League title holder Real Madrid:
- Cristiano Ronaldo: 2nd, 133 million €
- Gareth Bale: 10th, 60 million €
- James Rodríguez: 15th, 50 million €
- Isco Alarcón: 17th, 45 million €
- Karim Benzema: 21st, 43 million €
- Toni Kroos: 23rd, 41 million €
- Luka Modri?: 27th, 37 million €
- Sergio Ramos: 40th, 33 million €
- Daniel Carvajal: 68th, 25 million €
- Raphaël Varane: 87th, 23 million €
- Marcelo Vieira: 94th, 22 million €
The transfer values are calculated using an exclusive algorithm developed on the basis of over 1,500 fee paying transfers occurred since 2009. The variables included in our exclusive econometric model refer to player performances (matches, goals, dribbles, etc.), their characteristics (age, position, contract duration, etc.), as well as competition level and results achieved by their teams (clubs and national sides).
For more information, you are kindly invited to read chapter four of this paper on the CIES Football Observatory’s approach for sustainable success.
A Digital Atlas to celebrate the Football Observatory’s 10th birthday
This tool is freely available online from our website. It enables anyone to analyse the state of the game in 31 European countries and to follow its progress from year to year. The indicators offered study the characteristics of players from over 500 first division clubs from the perspective of age, height, mobility, training, origin, etc.
By consulting the Atlas, you can notably learn that there is almost 10cm of difference between the club with the tallest players, Diósgyör (186.3cm on average), and that with the shortest ones, Barcelona (177.3).
The Atlas also allows for comparisons between leagues. Regarding age, for example, it shows that the Italian Serie A regroups the oldest footballers (27.3 years on average), while the Dutch Erdivisie is made up of the youngest ones (24.2).
Issue number 92 of the Big-5 Weekly Post helps situate the five major championships in the European context from the point of view of the average age of squad members. It also presents the average age for the 98 big-5 league clubs. The Post notably shows that more than 5 years separate the youngest club, Valencia, from that which gathers the oldest players, Atalanta.
From January onwards, the Football observatory’s academic team will also offer monthly reports instead of our annual paying publications. Like our Digital Atlas, these will also be freely accessible from our website. The first issue will cover the topic of club instability. Moreover, we shall continue the publication of the Big-5 Weekly Post. We are open to sponsorship proposals.
In autumn 2015, we also plan to publish a book destined for the general reader summarising the key points garnered from our analyses over the past decade. There are indeed over 20,000 football enthusiasts like yourselves now on our mailing list. We warmly thank your for your interest in all our numerous areas of initiative.
Happy Christmas and best wishes for 2015!
The CIES Football Observatory unveils its exclusive approach for long-term success
Moreover, issue number 91 of the Big-5 Weekly Post presents the results of the analysis of the ASAR ratio for clubs from the five major European championships. The ratio is obtained by dividing the average stay of players in the first team squad of their employer club (the longest, the best) with their age at recruitment (the youngest, the best).
Indeed, the analyses carried out since 2005 show a strong correlation in all countries between this ratio and the results obtained by clubs at the end of the season. It is thus not surprising to note that the five clubs that are currently at the top of the table in their respective league are also in the top 20 positions of the ASAR ranking at European level:
- Real Madrid (2nd both at big-5 league level and Spain)
- Juventus (7th and 1st in Italy)
- Bayern Munich (9th and 2nd in Germany)
- Chelsea (11th and 1st in England)
- Marseille (19th and 2nd in France)
From an ASAR perspective, the most over-performing teams so far are Sevilla, Genoa and Valencia. Conversely, Real Sociedad, Borussia Dortmund, Everton, Cagliari and Lille clearly under-performed.
Our academic team is at the service of professional clubs to study their squads in greater detail.
Updated transfer value calculator
Thanks to our tool, anyone can obtain an accurate, up to date transfer value for players taking part in the five principle markets of European football: the English Premier League, Spanish Primera Liga, German Bundesliga, Italian Serie A and the French Ligue 1.
Our statistical model is based on almost 1,500 fee paying transfers having taken place at big-5 league club level from 2009 onwards. The correlation between estimated and actually paid sums is greater than 80%. This shows that we have been able to reveal the logics of the transfer market. This allows us to anticipate events and highlight market bias.
Our team is at service of market actors for expert audits for both big-5 league players and professional footballers playing in other championships at worldwide level.
Do not hesitate to access the calculator here.
Best players according to area of play: shining Ronaldo
Our rankings highlight not only the best performing players overall, but also those who performed the best with regard to teammates. This approach allows us to pick out more players who are not yet part of the top clubs. This is particularly useful from a scouting perspective. To limit bias, only footballers having played at least 66% of match time since the start of the season are included in the study.
In absolute terms, the best big-5 league players at present are Cristiano Ronaldo (Real Madrid) both in shooting and chance creation, Eden Hazard (Chelsea) in take on, Xabi Alonso (Bayern Munich) in distribution, Mathieu Coutadeur (Lorient) in recovery and Javi Manquillo (Liverpool) in rigour.
At the top of the relative rankings, we find Charlie Austin (QPR) in shooting, Xabi Prieto (Real Sociedad) in chance creation, Federico Cartabia (Córdoba) in take on, Roberto Trashorras (Rayo Vallecano) in distribution, Alaixys Romao (Marseille) in recovery and Mathieu Bodmer (Nice) in rigour.
Actors from professional clubs can contact us to enquire about our range of products in the domain of performance analysis.
Key performance indicators
- Shooting: ability to exploit goal opportunities through accurate shooting
- Chance creation: ability to putting teammates in a favourable position to score
- Take on: ability to create advantageous situations by successfully challenging opponents
- Distribution: ability to keep a hold on the game through efficient passing
- Recovery: ability to minimise opponents’ chances through proficient interception work
- Rigour: ability to minimise opponents’ chances through robust duelling
Real-Barcelona tops the rankings for the most “expensive” matches
In the other championships, the most “expensive” matches this season were Manchester City-Chelsea (578 million €), Paris St-Germain-Marseille (503 million €), Bayern Munich-Borussia Dortmund (272 million €) and Inter-Napoli (263 million €).
This analysis shows the increasing impact of money at the highest level of European football and the difficulty encountered by the vast majority of teams to reach the performance levels of the richest clubs. This state of affairs leads to more predictable results.
Thus, the five clubs touted by our research team as favourites at the start of the season are either in the first (Bayern Munich, Chelsea) or second place (Paris St-Germain, Barcelone, Rome) of their respective championships.
New record high for expatriate presence in the big-5
The expatriate presence is particularly high in the English Premier League (59.3%. A new record high since 2009 was measured this season in Italy (54.8%) and Spain (38.9%). Expatriates represent 43.5% in Germany and 31.6% in French Ligue 1. Compared to one year ago, the percentage of football migrants went up in all big-5 leagues with the exception of the English Premier League (-1.6%).
The biggest increase since 2009 was registered in Italy: from 42.4% to 54.8% (+12.4%), while the strongest growth since November 1st 2013 was measured in the German Bundesliga: from 38.1 to 43.5% (+5.4%).
For the first time in history, the main exporting country is France: 113 players compared to 112 for Brazil (former leader) and Argentina. The strongest increase since 2009 was recorded for Spain (from 17 to 58 players in foreign big-5 leagues). During last year, the biggest growth was for Serbia (28 to 39, +11) and Belgium (31 to 41, +10).
More data is available on request at football.observatory@cies.ch
Height on the pitch: records since 2009
Since the start of the 2014/15 seasons, the teams having fielded the shortest line-ups per league are Barcelona (176.4 cm), Nice (177.0 cm), Empoli (178.2 cm), Hertha (179.4 cm) and Manchester City (179.8 cm).
Conversely, at the head of the rankings of the tallest formations during current season are Stoke City (188.0 cm), Schalke 04 (186.7 cm), Verona (186.2 cm), Monaco (185.5 cm) and Elche (183.6 cm).
CIES Football Observatory at Sportdata & Performance Forum
Key topics of the Forum also include: creating a global standard for live sport data, low cost performance tools, coach-led analytics, data in science and sport medicine, evidence-based decision making in modern coaching, monetising sports data and video content across multiple platforms, interactive panel discussions, as well as networking activities.
The presentation of the CIES Football Observatory is available on request after the event. Interested parties can contact us at football.observatory@cies.ch
View the dedicated event website here.
For the full event programme and how to be part of it, sponsorship and attendance availability email Edward Abankwa at EdwardA@pinnacle-management.com
Click here to REGISTER ONLINE. You can also ring +44(0)7956 675521 / +44 (0)208 657 4062.
Email Ian Brumpton at ian@pinnacle-management.com with partnership and marketing enquiries.
Barcelona top the charts for producing the most big-5 league players
Out of the 43 big-5 league footballers trained at Barcelona, 13 are still playing for the Catalan club. Only Olympique Lyonnais, Athletic Bilbao and Real Sociedad have a greater number of club-trained players in their current squad. To be able to rely on homegrown talent in this way has provided a key competitive advantage for Barcelona over the last decade. Munir El Haddadi and Sandro Ramírez are the latest examples of this strategy.
Barcelona is also at the top of the table of clubs having trained the most footballers playing for other big-5 league teams (30), ahead of Real Madrid (26) and Manchester United (24). This finding not only highlights the quality of training provided by these top teams, but also demonstrates the difficulty for youth academy players to breakthrough into the first team squad of the most competitive club. This is unlikely to change in the near future, irrespective of the legal framework in force.
River Plate heads the ranking for clubs not participating in the big-5 leagues. The Argentinean team has trained 17 players currently employed by teams in the five major European championships, which is two more than Le Havre, Ajax and Munich 1860.
Issue 86 of the CIES Football Observatory Big-5 Weekly Post also shows that the percentage of club-trained players went down for the fourth consecutive season and has now reached a new record low: 17.2% of squad members. This percentage varies between 24.6% in France and 9.6% in Italy. To be considered club-trained, a player must have played for at least three seasons between the ages of 15 and 21 for his employer club (UEFA criterion).
More information is available on request at football.observatory@cies.ch
Manchester United second youngest line-up in Europe
At the opposite end of the table, Manchester City fielded the third oldest line-up at big-5 league level: 29.3 years (highest figure in the English Premier League). This suggests that fresh blood is needed to maintain top level performance standards over the long term. Only Verona (31.0) and Torino (30.3) fielded more seasoned players than Manchester City.
Since 2008/09, the youngest line-up in the big-5 was fielded by Nice: 22.1 years on average against Evian on 10.05.2014. Conversely, the team having fielded the oldest line-up is Milan AC: 33.3 years against Catania on 03.05.2009.
The data on the last match day for all big-5 league clubs is available in the 85th Weekly Post. For more information, please contact us at football.observatory@cies.ch
New “ranking by minute” statistics: there is hope for Manchester United
Since the beginning of the English Premier League season, Manchester United achieved the third highest score in points achieved by minute played, ahead of Manchester City (5th). This suggests that Louis van Gaal’s team should be able to further improve its results in the near future. The gap measured with respect to Chelsea is indeed not as significant as at the end of the matches played so far (-0.42 compared to -1.14). Conversely, Arsenal is ranked only 16th.
At individual player level, in the English Premier League Marcos Rojo (Manchester United) has achieved the most points by minute played: 2.39 on average. The lowest figure among footballers who have played at least half of total match minutes was recorder for Niko Kranj?ar (QPR, 0.31).
Players with the most impressive statistics in the remaining big-5 European leagues are Pablo Piatti (Valencia), Dimitri Payet (Marseille), Arjen Robben (Bayern) and Angelo Ogbonna (Juventus). In contrast, the least successful players so far this season besides Niko Kranj?ar are Xabi Prieto (Real Sociedad), Mathieu Peybernes (Bastia), Julian Draxler (Schalke 04) and Daniele Conti (Cagliari).
The minute by minute rankings will be updated after each championship round. They will be available throughout the season on the CIES Football Observatory website.
Cesc Fàbregas makes the difference
The best performing players in the other positions are Giorgio Chiellini (centre back), Jordi Alba (full back), Xabi Alonso (central/defensive midfielder) and André-Pierre Gignac (forward). Only footballers who played at least 60% of championship minutes are included in the analysis.
Many footballers who did not yet represent a national A-team are to be found in the top 15 positions of the rankings: Robin Knoche (Wolfsburg), José Fonte (Southampton), Antonio Balzano (Cagliari), Layvin Kurzawa (Monaco), Juan Bernat (Bayern Munich), Roberto Pereyra (Juventus), James Ward-Prowse (Southampton), Manuel Nolito (Celta Vigo) and Wissam Ben Yedder (Toulouse). All these footballers deserve a chance to play for their country of origin.
Players are ranked according to their production and efficiency in six areas of the game (see below). The six key performance skills taken into account are weighted differently per position according to their impact on club results. Consequently, for example, rigour is more important for centre backs than for forwards. For more comparability, the rankings also consider the differences in the intensity and style of play between leagues.
CIES Football Observatory key performance skills
- Shooting: ability to take advantage of goal opportunities through accurate shooting
- Chance creation: ability to put teammates in good position to score
- Take on: ability to create dangerous situations by successfully challenging opponents
- Distribution: ability to hold the grip on the game through efficient passing
- Recovery: ability to minimise goal opportunities for opponents through proficient ball recovery
- Rigour: ability to minimise goal opportunities for opponents by efficiently blocking their actions
Records broken during 2014 summer transfer window
A new record high was also measured with regard to the percentage of transfer fees invested with 49% of the ten most active clubs now involved in this activity. In addition, the level of transfer fee compensation paid by clubs in the most active league – the English Premier League - reached a new peak of 45% of total transfer expenditure.
All of these findings show the increasing concentration of fee paying transfer activity at the very top of the football pyramid. At the same time, and as shown in issue 81 of the Big-5 Weekly Post, an increasing proportion of fees invested do also benefit other big-5 league clubs (72% during the last transfer window compared to 67% for the five previous years). These figures highlight the ongoing transformation of the transfer market into a zero-sum game involving a closed circle of top level teams and with significant amounts of money made by dominant intermediaries and/or third-parties.
The club that invested the most on the transfer market since 2008 was Real Madrid €750 million, closely followed by Manchester City (€733 million).
CIES Football Observatory online database updated
Data refers to the indicators of average age, average height, % of club-trained players, % of internationals, % of expatriates and average stay.
More detailed data relating to club level analysis is presented in our annual publications: Annual Review (big-5 leagues) and Demographic Study (31 top division leagues in Europe).
We also kindly remind you that an online tool to assess the transfer value of big-5 league players is available here.
Thank you very much for your interest!
Transfer analysis: big-5 leagues as closed system
The team who was able to generate the most incomes by transferring players to big-5 league clubs is Southampton (120.7 million €). The English team outranks Real Madrid (112 million €) and Chelsea (102.4 million €). The only non big-5 league clubs in the top 10 of the ranking is Porto (83.8 million €). However, a big part of transfer incomes of the Portuguese team was finally due to third-parties that held shares on the economic rights of players transferred.
Among the 46 teams that earned at least 15 million €, only six are not part of big-5 leagues: Benfica, Ajax, Sporting Lisbon, Feyenoord, Dinamo Kiev and Salzburg. More information is available in the 81st issue of the Big-5 Weekly Post.
CIES Football Observatory’s big-5 league predictions
This year’s predictions take into account the following areas: players’ status, squad cohesion and club ambition. The indicator of players’ status considers minutes played by squad members during the previous season, as well as overall results achieved by their employer club. Squad cohesion refers to the percentage of domestic league minutes played in 2013/14 by footballers who are still at the club, as well as the average number of seasons played by current squad members at the employer team. Finally, club ambition includes the average length of contract duration of first team players, as well as the ratio between the status of new signings and that of footballers released by the club during the last transfer window.
Analysis of the above criteria by the CIES Football Observatory academic team indicates that Chelsea, Barcelona, Paris St-Germain, Bayern Munich and Rome are in the most favourable position to win the title in their respective leagues. Our data also suggests that the runners-up will be Manchester City, Real Madrid, LOSC Lille, Borussia Dortmund and Juventus. Among promoted teams, Leicester City, Burnley, Deportivo La Coruña, Metz and Cologne are well placed to achieve good results. In contrast to this, the following clubs are forecast to struggle in achieving satisfactory results: Crystal Palace, Sunderland, Almería, Nice, Eintracht Frankfurt and Chievo Verona.
Enjoy the season and may the best teams win!
Transfer market inflation continues at big-5 league level
Our ‘right price’ has been calculated as the average between a player’s transfer value both before and after the deal. Significantly, the latter figure also considers the new contract duration of the footballer recruited. Both values have been calculated according to the exclusive CIES Football Observatory statistical model which incorporates nearly 1,500 fee paying transfers completed since 2009 (see below).
Our new data analysis has revealed that overall clubs paid on average 16% more than they invested in the five previous years for players with similar characteristics (add-ons included). This confirms the ongoing inflation trend of the transfer market at the top end of the football pyramid. The inflation trend is mainly due to the sums spent by a handful of wealthy clubs. This was notably the case for Manchester United with regard to Angel Di María (+30 million € between the right price and fee reported), for Paris St-Germain for David Luiz signing (+ 29 million €) and for Real Madrid in the case of James Rodríguez (+25 million €).
At the opposite end of the table, our analysis shows that the existence of buy-out clauses and/or non-sporting related issues allowed Barcelona to reduce their offer for Luis Suárez (-12 million € between the right price and money invested). The same holds true for Chelsea with Diego Costa’s signing (-10 million €). In absolute terms, Mario Balotelli was the most under-paid player (-16 million €).
The full picture for all players transferred for a fee of at least 10 million € (including add-ons) is presented in the 79th edition of the Big-5 Weekly Post. We also kindly remind you that our unique and simple online calculator to estimate the current transfer value of big-5 league players is freely accessible here.
The CIES Football Observatory stays at your disposal for any query or more information. Enjoy the season!
CIES Football Observatory’s statistical model
The CIES Football Observatory academic team has developed an exclusive statistical model to assess the transfer value of players and predict transfer fees. This powerful econometrical model is based on the in-depth analysis of a sample of nearly 1,500 players transferred for a fee from big-5 league teams since the summer transfer window preceding the 2009/10 season. The statistical model developed includes a multitude of variables relating to the following areas: age, length of remaining contract, position, player performance at club level for the most recent and previous seasons, results of the clubs for which players are employed, as well as players’ international experience and results of national team represented.
Groundbreaking player transfer value calculator
The new transfer value calculator uses an algorithm created on the basis of nearly 1,500 fee paying transfers occurred during the previous five years at big-5 league clubs. The exclusive algorithm will continue to be updated after every transfer window to take into account the latest market trends.
More information on the statistical model developed by the CIES Football Observatory academic team and detailed analysis of current big-5 league players is available in the latest edition of the CIES Football Observatory Annual Review. A free excerpt of this publication can be downloaded here.
The scientific analysis of player transfer values perfectly complements the two other main CIES Football Observatory research areas: squad composition and pitch performance. All of these areas of study are of high importance to clubs as they are able to assist in raising performance levels from both a sporting and economic perspective.
Moreover, the transfer value calculator will help to increase the level of transparency in the beautiful game as all stakeholders – from club officials to the general public – will be able to compare actual fees paid to those estimated as the fair transfer value by the calculator.
The CIES Football Observatory academic team is at your disposal for more detailed analysis. Its services notably include the elaboration of scenarios for future transfer values. For more information about our products and services, please contact us at football.observatory@cies.ch
Player Development Ranking for the 2014 World Cup
The ranking takes into account the number of World Cup participants trained per club, as well as the number of league matches played by footballers per team up to the age of 23. This age limit has been set according to FIFA regulations on training indemnities. Training clubs have been defined according to the UEFA definition of at least three years at the club between the ages of 15 and 21.
At the top of the table is Feyenoord Rotterdam. The Dutch team trained 9 players participating in the World Cup. Two other clubs trained as many footballers as Feyenoord: Barcelona and Deportivo Saprissa. However, World Cup participants played 882 matches at Feyenoord until the age of 23, compared to 783 at Barcelona (not including B-team matches) and 445 at Deportivo Saprissa.
At national association level, France tops the table ahead of England and Germany. This is mainly due to the high number of footballers trained in France playing for other national A-teams, notably Africans. This finding also reflects the high employment rate of U23 players in French clubs. In total, 821 clubs in 59 national associations have contributed to the development of World Cup players. The full list of clubs is available here.
We also remind you that the brand new edition of our Annual Review on the five major European leagues is available for sale from the CIES online shop. A free excerpt is available here.
The Football Observatory reveals how to select a winning World Cup squad
The Observatory academic team have selected the following indicators for assessing the potential of the 2014 World Cup participants:
- League matches during career
- League matches for the two years preceding the event
- League goals during career
- League goals for the two years preceding the event
- National A-team matches for the two years preceding the event
- World Cup matches during career
The results for each national team are illustrated through a diagram with green or red boxes. A green box means that the value measured for the team is superior to the minimal figure observed for the last four World Cup finalists for the 11 players with the highest values. If this is not the case, the box is red. The greater the proportion of green boxes, the higher the probability of reaching the final stages of the competition. In the case of a tie, we took into account the number of World Cup matches of national teams during the last four editions.
This approach has also allowed us to predict a hypothetical scenario for the outcome of the competition, suggesting that Spain will beat Brazil in the final, with Argentina in 3rd place and France in 4th position. The full analysis is presented in the World Cup Scenario report.
New edition of the CIES Football Observatory Annual Review
The CIES Football Observatory Annual Review is an essential tool for all forward-thinking teams to benchmark themselves against rivals and implement the most suitable strategies for sustainable success. The analysis provided is also of great interest for professionals involved in the transfer market operations, media and the general public. An excerpt of this 96-page landmark publication can be downloaded here. The paperback report is available for purchase from the CIES online shop.
As of June 2013, Lionel Messi is the big-5 league footballer with the highest market value. According to the CIES Football Observatory’s exclusive econometrical model, the estimated value of Barcelona’s player is almost twice as high as for Cristiano Ronaldo: € 216 versus € 114 million. This is mainly related to the younger age of the Argentinian prodigy. However, contrary to Ronaldo’s market value, Messi’s decreased during last year due to lower performance levels (- € 19 million).
The comparison between transfer fees paid by clubs to sign new players at the start or during the 2013/14 season and their current market value allows us to assess the best and worst recruitments from a financial perspective. The highest negative gap was recorded for Gareth Bale (€ -37 million). This finding reflects the fact that Real Madrid clearly paid over the odds to convince Tottenham to release the player. In 2013/14, the Castilian team broke the record for the most expensive line-ups fielded with an average transfer expenditure per player of € 32.3 million in their Champions League winning campaign.
Results achieved by Spanish title winners Atlético Madrid were outstanding with an average transfer fee of “only” about € 4.3 million per player on the pitch. From an economic perspective, it is also worth highlighting results obtained by some of the clubs that were among those that spent the least to sign players fielded such as Crystal Palace in England, Elche in Spain, Guingamp in France, Augsburg in Germany and Hellas Verona in Italy. This publication will allow you to understand what factors permitted these clubs to over-perform.
While not directly focused on national teams, the findings presented in this publication can also be interpreted in the light of the upcoming World Cup. For example, our analysis of the pitch performance of players suggests that it will be very difficult to score against Brazil. Indeed, Thiago Silva, Dante, Dani Alves, Maxwell, Marcelo and Maicon are among the best performing players in their respective position. Felipe Scolari could even afford not to select other very productive and efficient defenders such as Rafinha and Luis Filipe.
However, our analysis also shows that Brazilian players are less represented among the best performing midfielders and forwards. Spain appears thus to have a more complete squad with at least one player in the top 10 of the rankings for each position. Of course, the outstanding talent of the four best performing forwards, Cristiano Ronaldo (Portugal), Luis Suárez (Uruguay), Ciro Immobile (Italy) and Lionel Messi (Argentina), could prove to be a lethal weapon for opponents. Within one week, the CIES Football Observatory will also disclose its World Cup predictions using a brand new methodology.
Assessment of 2013/2014 big-5 league predictions
The average gap between the league position estimated and that finally achieved at big-5 level was 3.3 positions: from 4.2 in Germany to only 2.3 in England. The ranking gap was higher by 3 for less than two thirds of teams. More information is available here.
Amongst the teams that obtained better results than expected were Torino, Augsburg and Liverpool. In the under-performing team category, we find clubs such as Real Betis, Milan and Manchester United.
This season, the Football Observatory academic team were able to predict 12 of the 15 teams that finished in the top three positions in their respective league: 3 out of 3 in Spain and Germany, followed by 2 out of 3 in Italy (Juventus and Napoli), France (Paris St-Germain and Monaco) and England (Manchester City and Chelsea).
In relation to the actual champions, we were only able to predict 2 out of 5 (Juventus and Paris St-Germain), while Borussia Dortmund finished in second place, Champions League winners Real Madrid in third position and Manchester United ranked only 7th. Since our first predictions in 2010/11, we have correctly forecast 9 champions out of a possible 20 (45%).
Updated website launched with team of the season line-ups
Each starting 11 has been selected by taking into account players’ production and efficiency in six key areas of the game. Only footballers who played at least 60% of minutes in their respective league were taken into account. Goalkeepers have been selected with the highest % of saves.
Each team is made up of a goalkeeper, two centre backs, a left full back, a right full back, two central or defensive midfielders, two offensive midfielders and two forwards as per the 4-4-2 formation.
In the big-5 league line-up are two Juventus (Buffon and Chiellini) and Real Madrid (Di María and Ronaldo) players, as well as one player each for Barcelona (Dani Alves), Bayern Munich (Alaba), Manchester City (David Silva), Paris St-Germain (Thiago Silva), Liverpool (Suárez), Atlético Madrid (Gabi) and Roma (Pjani?). Among these players, only Gabi and Alaba will not participate in the 2014 World Cup.
All the rankings are available on the CIES Football Observatory website, see Big-5 Weekly Post (issue 76). Deeper analysis will be presented in the 9th edition of our Annual Review to be published during the first week of June.
Our metrics measure players’ pitch production and efficiency in six complementary areas of the game.
CIES Football Observatory key performance indicators
- Shooting: ability to take advantage of goal opportunities through accurate shooting
- Chance creation: ability to create goal opportunities through efficient passing
- Take on: ability to create dangerous situations by successfully challenging opponents
- Distribution: ability to hold the grip on the game through efficient passing
- Recovery: ability to minimise goal opportunities for opponents through proficient ball recovery
- Rigour: ability to minimise goal opportunities for opponents by efficiently blocking their actions
Data in each area is weighted according to the impact on club results per position. Consequently, for example, rigour is more important for centre backs than forwards, while the opposite holds true for shooting.
Southampton has the fourth youngest defence in Europe
In England, Fulham fielded the oldest midfielders and forwards, as well as the second most seasoned defenders after West Bromwich Albion. Conversely, Southampton defence was the fourth youngest at European level. All the information is available on the CIES Football Observatory website.
Big-5 Weekly Post on players born in the 1970’s
Crystal Palace goalkeeper Julián Speroni heads the ranking for minutes played by footballers born in the 1970’s in England. In the other leagues, at the top of the tables are Morgan De Sanctis (Roma, Italy), Olivier Sorlin (Evian, France), Esteban Suéarez (Almería, Spain), Raphael Schäfer (Nürnberg) and Zden?k Posp?ch (Mainz, Germany).
All the rankings are to be found on the CIES Football Observatory website.
April rankings of the best big-5 league players
In England, at the top of the tables are players from four clubs: Džeko (Manchester City), Cazorla (Arsenal), Schneiderlin (Southampton), Azpilicueta and Cahill (Chelsea).
In Spain, Aduriz (Athletic Bilbao) was the only best performing footballer who does not play for Real Madrid (Isco and Sergio Ramos) and Barcelona (Busquets and Dani Alves).
In France, PSG is the only club with two players at the top of the ranking: Cavani and Cabaye. Sertic (Bordeaux), Perrin (St-Etienne) and Bedimo (Lyon) head the remaining tables.
In Germany, players from four different clubs are at the top of the rankings: Oli? and de Bruyne (Wolfsburg), Schweinsteiger (Bayern), Spahi? (Leverkuesen) and Posp?ch (Mainz).
In Italy, finally, no club has more than one player at the top of the tables: Immobile (Torino), Hernanes (Inter), Inler (Napoli), Chiellini (Juventus) and Pasqual (Fiorentina).
Our metrics measure players’ pitch production and efficiency in six complementary areas of the game.
CIES Football Observatory key performance indicators
Shooting: ability to take advantage of goal opportunities through accurate shooting
Chance creation: ability to create goal opportunities through efficient passing
Take on: ability to create dangerous situations by successfully challenging opponents
Distribution: ability to hold the grip on the game through efficient passing
Recovery: ability to minimise goal opportunities for opponents through proficient ball recovery
Rigour: ability to minimise goal opportunities for opponents by efficiently blocking their actions
Data in each area are weighted according to the impact on club results per position. Consequently, for example, rigour is more important for centre backs than forwards, while the opposite holds true for shooting.
Big-5 Weekly Post on U20 players
The U20 footballer who played the most league minutes so far is Matthias Ginter (Freiburg), followed by Saúl Ñíguez (Rayo Vallecano) and Luke Shaw (Southampton). Four other U20 footballers played for more than 2,000 minutes: Aymeric Laporte (Athletic Bilbao), Issiaga Sylla (Toulouse), Morgan Sanson (Montpellier) and Hakan Çalhano?lu (Hamburg).
The most fielded U20 player in Italy is Ibrahima Mbaye (Livorno). The tenth most employed U20 player was only fielded for 270 minutes in Italy. This figure is 1,115 in Germany, 1,028 in France, 790 in England and 437 in Spain.
For more information, please go to the CIES Football Observatory website or contact us at football.observatory@cies.ch
Big-5 Weekly Post on shooting production
In England, the highest increase in shots on target per match after 1st of January was observed at Cardiff City, from 2.9 to 3.9 (+34%). Conversely, the greatest decrease was registered for Everton, from 5.8 to 4.7 (-19%). Shooting production went up at Liverpool and Chelsea, while it decreased at Manchester City and Arsenal.
In Spain, shooting production increased the most at Málaga (3.8 to 4.3, +13%). Despite the excellent results achieved, Atlético Madrid took much fewer shots on target after 1st of January than in the first part of the season (6.5 to 4.1, -37%). If this trend continues, the Colchoneros will most probably struggle to win the league title.
In France, the highest negative gap for shots on target was measured at Nice (3.6 to 2.4, -33%). The reverse holds true for Montpellier (3.3 to 4.9, +48%). Paris St-Germain shooting production remained stable: 6.0 shots on target per match (highest figure in France for both first and second semester).
In Germany, the shooting production of Hertha Berlin decreased by 26% (4.7 to 3.5). At the opposite end of the table is Hoffenheim (5.0 to 7.1, + 42%). The number of shots on target per match also increased for Bayern Munich (7.5 to 7.9, +5%).
In Italy, shooting production of the probable future league winner Juventus went heavily down after 1st of January (7.1 to 4.6, -35%). On the contrary, Genoa players took significantly more shots on target in the second part of the season than in the first one: 2.9 to 4.5 (+55%).
At big-5 league level, the ten most productive clubs in terms of shots on target in the second part of the season are Bayern Munich (7.9), Real Madrid (7.7), Hoffenheim (7.1), Liverpool (7.1), Barcelona (6.8), Borussia Dortmund (6.2), Schalke 04 (6.1), Paris St-Germain (6.0), Manchester City (5.9) and Chelsea (5.9). Six of these teams qualified for the quarter of finals of the Champions League and three will play the semi-finals.
More data are to be found on our website. For more information, please contact us at football.observatory@cies.ch.
Big-5 Weekly Post on competitive (un)balance
During current season, the three top ranked teams per league achieved 75% of possible points. This figure is 5% greater than the previous highest levels measured in 2011/12 and 2012/13. A new record high was measured in Spain (80.9%), Italy (77.8%), Germany (73.2%) and France (71.2%). In England, the current level (74.2%) is “only” the second highest since 2008/09. Our analysis clearly confirms the growing competitive unbalance in the richest European leagues.
For more information, please contact us at football.observartory@cies.ch
Best players for the month of March
In the English Premier League, at the top of the rankings are two Liverpool (Suárez, Coutinho) and three Swansea players (Britton, Chico, Rangel). This finding suggests that the Welsh club should be able to further improve its results until the end of the season.
In Spain, Barcelona beats Real Madrid 3-2: Xavi, Alves and Mascherano versus Ronaldo and Di Maria. Only three footballers in the top 3 of their respective position do not play for the three best ranked teams: Rakiti? (Sevilla), Angulo (Granada) and Galvez (Rayo Vallecano).
In France, PSG players head three rankings out of five: Ibrahimovi?, Thiago Motta and Thiago Silva. Two very promising footballers top the table for offensive midfielders (Benjamin André) and full backs (Serge Aurier). Both have the ability to play in more competitive teams or leagues.
In Germany, Bayern Munich players are ranked first in four tables out of five: Kroos, Schweinsteiger, Rafinha and J. Boateng. However, the best performing forward was Anthony Modeste, who also scored against the Bavarian side during last week-end.
In the Italian Serie A, at the top of the rankings for forwards is the best scorer of Torino Ciro Immobile. Another Torino player, Giuseppe Vives, tops the table for central and defensive midfielders. Barrientos (Catania), Jonathan (Inter) and Paletta (Parma) head the remaining tables.
Our metrics measure players’ pitch production and efficiency in six complementary areas of the game.
CIES Football Observatory key performance indicators
Shooting: ability to take advantage of goal opportunities through accurate shooting
Chance creation: ability to create goal opportunities through efficient passing
Take on: ability to create dangerous situations by successfully challenging opponents
Distribution: ability to hold the grip on the game through efficient passing
Recovery: ability to minimise goal opportunities for opponents through proficient ball recovery
Rigour: ability to minimise goal opportunities for opponents by efficiently blocking their actions
Data in each area are weighted according to the impact on club results per position. Consequently, for example, rigour is more important for centre backs than forwards, while the opposite holds true for shooting.
Big-5 Weekly Post on transfer expenditure
This fidning demonstrates the existence of a strong big-5 league club internal market. It also shows that the redistribution effect of the transfer system throughout the entire football pyramid is limited.
The club which generated the most income from the transfer of squad members to big-5 league clubs was Tottenham Hotspur (322 million €), closely followed by Spanish giant Real Madrid (304 million). Only five non big-5 league teams are among the 30 clubs that generated the most transfer incomes since 2008/09: Porto (3rd), Palermo (12th), Benfica (16th), Ajax (26th) and Portsmouth (28th). Conversely, many rich teams are ranked in the top 20 positions of the table: Liverpool (4th), Milan (5th), Inter Milan (6th), Arsenal (8th), Roma (9th), Barcelona (15th), Manchester United (17th), Chelsea (19th) and Manchester City (20th).
While the majority of the above-mentioned clubs also spent significant fees to sign new players, our findings show that the current transfer system cannot counter the growing competitive imbalance between clubs at different levels of the league structure. It also suggests that teams with a track record of training new players are not sufficiently rewarded financially as the most lucrative transfers mainly occur between the wealthiest clubs.
Moreover, the growing number of transfers highlighted in the CIES Football Observatory Demographic Study 2014 shows that the current transfer system does not efficiently prevent contract instability. On the contrary, players’ mobility is on the increase. This goes hand in hand with the expansion of third-party ownership deals, through which private investors are entitled to shares on future transfer fees. This further undermines the redistribution role of the transfer system throughout the football pyramid.
Our analysis highlights that reform of the current transfer system is needed. An efficient solution would be to redistribute any transfer income to all clubs where a footballer has played during his career according to the total number of matches played for each club. This would ensure a fairer distribution of money to the whole chain of clubs that allowed the player to develop his career before attracting interest from the richest teams. The CIES Football Observatory academic team is at your disposal to undertake simulations for different redistribution scenarios. For more information, please contact us at football.observatory@cies.ch.
Exclusive data from the 2014 World Cup Preview
The employer club whose footballers played the most minutes of World Cup qualification matches is Real Madrid, followed by six other big-5 league clubs: Barcelona, Bayern Munich, Juventus, Manchester United, Chelsea and Manchester City. The highest ranked club not participating in the big-5 leagues is Zenit St-Petersburg (8th), while the first non-European team is Esteghlal FC of Iran, in 14th place.
Big-5 league teams represent two thirds of the 30 top ranked clubs. In total, 48.9% of minutes played were by footballers under contract with top division teams in England, Spain, Italy, Germany and France. This finding reflects the high concentration of national A-team players in the most competitive European championships.
All national teams qualified fielded players employed by big-5 league clubs. However, the percentage of minutes played by big-5 league footballers was below 25% for Australia, Costa Rica, Ecuador, Honduras, Iran, South Korea and Russia. These nations will most probably struggle to qualify for the knockout stages.
We hope that you will enjoy the new statistics presented in our 2014 World Cup Preview and we stay at your disposal for more analysis at football.observatory@cies.ch.
Players from 101 nations in the big-5 leagues
France is the country with the highest number of locally born players fielded by clubs in the five major championships since the start of the season (440), followed by the four other nations hosting the big-5 leagues. However, only 181 players born in England played in the big-5 so far this season.
The most represented foreign origin overall is Brazil (117 players). At league level, the most represented foreign nations are France (45) in England, Argentina and France (29) in Spain, Brazil (20) in France, Czech Republic (14) in Germany and Argentina (51) in Italy.
Next week we will present exclusive data sourced from the upcoming 2014 World Cup Preview. For more information about this publication, please contact us at football.observatory@cies.ch
Best players for the month of February
In the four other leagues covered, the most productive players were as follows:
Spain: Lionel Messi, Andrés Iniesta, Sergio Busquets, Adriano Correia and Aymeric Laporte
France: Zlatan Ibrahimovi?, Grégory Sertic, Geoffrey Kondogbia, Gregory van der Wiel and Loïc Perrin
Germany: Mario Mandžuki?, Mario Götze, Thiago Alcântara, Márcio Rafinha and Nikol?e Noveski
Italy: Luca Toni, Marek Hamšík, Andrea Pirlo, Abdoulaye Konko and Mehdi Benatia
Our analysis also highlighted the outstanding performances of young talents such as Jonny Castro (Betis Sevilla) and Samuel Umtiti (Olympique Lyonnais). More data are available on our website.
Our metrics measure players’ pitch production and efficiency in six complementary areas of the game.
CIES Football Observatory key performance indicators
Shooting: ability to take advantage of goal opportunities through accurate shooting
Chance creation: ability to create goal opportunities through efficient passing
Take on: ability to create dangerous situations by successfully challenging opponents
Distribution: ability to hold the grip on the game through efficient passing
Recovery: ability to minimise goal opportunities for opponents through proficient ball recovery
Rigour: ability to minimise goal opportunities for opponents by efficiently blocking their actions
Data in each area are weighted according to the impact on club results per position. Consequently, for example, rigour is more important for centre backs than forwards, while the opposite holds true for shooting.
We also kindly remind you that the 2014 edition of our Demographic Study is now available.
New edition of the Big-5 Weekly Post
At league level the Italian clubs recruit the oldest players (25,5) and the German clubs the youngest (23,2). All in all, four clubs have fielded players, who arrived on average after the age of 27 : Levante (27,6), Elche (27,2), Bastia and West Ham (27,0). In contrast, Real Sociedad (21,5), FC Barcelona (21,6) and Liverpool (21,9) have used players who have been recruited before the age of 22.
The data for each big-5 league club is presented in the 64th Big-5 Weekly Post which is now available here. We stay at your disposal for more information at football.observatory@cies.ch.
Big-5 Weekly Post on rookies
Fulham (Burn, Tunnicliffe, Cole and Tankovi?) and Crystal Palace (Ledley, McCarthy, Ince and Murray) top the table of the clubs having fielded the most players without previous big-5 league experience. The youngest rookie so far was Nahuel Leiva (Villarreal), 17 years, while the oldest was Nagore Gómez (Levante), 33 years.
The full list of rookies is to be found in the 62nd edition of the Big-5 Weekly Post. We stay at your disposal for more information at football.observatory@cies.ch.
Best performing big-5 league players for the month of January
Our analysis shows that the best performing players per position in England were Luis Suárez (forward), David Silva (offensive midfielder), Jack Cork (central/defensive midfielder), Laurent Koscielny (centre back) and Aleksandar Kolarov (full back). More information is available in the 61st issue of the Big-5 Weekly Post.
Our metrics measure players’ pitch production and efficiency in six complementary areas of the game (see explanation below). Data in each area are weighted according to the impact on club results per position. Consequently, for example, rigour is more important for centre backs than forwards, while the opposite holds true for shooting.
Moreover, all the indicators are comparable at international level as they were developed by taking into account the differences between leagues in both the style of play and game intensity. Our methodology is thus increasingly used by top-flight professional clubs to assess the strength of squad members or potential signings.
We also kindly remind you that the 2014 edition of our Demographic Study is now available. The CIES Football Observatory will also attend the first OptaPro Analytics Forum to be held Thursday. Drs Roger Besson and Raffaele Poli will present a poster on the fight against relegation in the English Premier League.
CIES Football Observatory key performance indicators
Shooting: ability to take advantage of goal opportunities through accurate shooting
Chance creation: ability to create goal opportunities through efficient passing
Take on: ability to create dangerous situations by successfully challenging opponents
Distribution: ability to hold the grip on the game through efficient passing
Recovery: ability to minimise goal opportunities for opponents through proficient ball recovery
Rigour: ability to minimise goal opportunities for opponents by efficiently blocking their actions
Big-5 Weekly Post on transfer fees
At club level, Real Madrid has invested the most to make up its current squad (536 million euro), followed by Manchester City (435) and Manchester United (395). In the remaining leagues, at the top of the tables are Paris St-Germain (366), Bayern Munich (233) and Juventus (214). Ten clubs spent less than 10 million euro to sign their current squad members. The lowest transfer expenditure in England was recorded for Crystal Palace (24 million euro).
For more information on the CIES Football Observatory, please contact us at football.observatory@cies.ch. We also kindly remind you that a free excerpt of the freshly published Demographic Study 2014 is available on our website.
New Big-5 Weekly Post on training clubs
Bayern Munich, Atalanta and Arsenal head the rankings in the remaining leagues. This analysis coincides with the publication of the 6th edition of the CIES Football Observatory Demographic Study. An excerpt is available here.
For more information please contact us at football.observatory@cies.ch
Brand new Demographic Study highlights the decrease of club-trained players in European clubs
The Study shows that professional European football is still confronted with processes that do not necessarily augur well for its future. The cloud of economic stakes that hangs over sporting logics is flagrant in many clubs and countries. In general, the number of transfers carried out by teams during the current season is at an all-time high. A trend that is difficult to understand given the actual climate with its numerous financial difficulties.
The increasing speculation surrounding players’ transfers is also visible through the progressive drop in the number of club-trained players, which has attained its lowest level since 2009. Conversely, the percentage of expatriate players has risen for the second consecutive year. Here too, the figure has never been so high.
To buy the publication, click here
For more information and to ask for educational discount, please write to football.observatory@cies.ch.
Key figures
- Despite the regulations introduced in many countries and at UEFA club competition level, the relative presence of footballers playing for the club where they were trained reached a new record low: 21.2%.
- The percentage of expatriate players reached a new record high this season: 36.8%. The proportion of footballers who have already experienced international migration during their career was also never as high as for current season: 49.3%.
- The English Premier League has the second highest percentage of expatriate footballers (60.4%), just after Cyprus. Expatriates represent a majority of squads also in Italy, Turkey, Portugal and Belgium. The greatest proportion was measured at Inter Milan (89%).
- While Brazil remains the most represented foreign origin, the number of Brazilians decreased by 67 since 2009: from 538 to 471. France is the second nation with the highest number of expatriates in top division European leagues: from 247 to 306 (+59) during the last five seasons.
- A new record high was also registered with regard to the number of new signings. On average, players recruited from January 2013 onwards represent 41.3% of squads (10.2 signings per club).
- Transfer activity is much higher in Southern and Eastern Europe than in the northern part of the continent. Cyprus tops the ranking of the highest number of squad members signed after January 2013 (on average 14.1 per club). This figure is only 5.3 in Sweden.
- Italy and England top the table for the largest squads (26.8 players per club on average). Italian Serie A also gathers the most seasoned footballers (27.3 years) and the least percentage of club-trained players (8.4%).
- The tallest league is German Bundesliga (183.8cm), while the shortest is Spanish Liga (180.1cm). Barcelona has the second shortest squad (177.4cm) among the 472 clubs surveyed. Only Bnei Sakhnin (Israel) is composed of shorter players than the Catalan side.
- The highest percentage of players with national A-team caps in 2013 was recorded in England (44.3%). At club level, the greatest proportion of active internationals was registered at Chelsea (80%). The London club outranks Manchester City and Fenerbahçe.
- Barcelona has the most stable squad among European top division teams. Players in the Catalan club have been on average for 5.5 years in the first team squad. The average stay is above 5 years in only one other club: Manchester United.
- Finally, the CIES Football Observatory study confirms the excellent work undertaken by Ajax Amsterdam in the area of youth training. The Dutch side tops the table of clubs having trained the most players under contract with top division teams in Europe. With 69 representatives, Ajax outranks Partizan Belgrade, Barcelona, Hajduk Split and Sporting Lisbon.
New Big-5 Weekly Post on player turnover
While the percentage of minutes played by the 11 most fielded footballers of clubs currently on the podium in their respective league is 77.6%, this figure is only 71.9% for clubs in the relegation zone. Our analysis thus suggests that bad results encourage coaches to change more frequently their line-ups. Rather than improving results, this strategy tends often to aggravate the situation.
At club level, the lowest player turnover levels were measured at Borussia Mönchengladbach (88.6% minutes played by the 11 most fielded players), Atlético Madrid (86.1%) and Lille (84.3%). At the opposite end of the table are Catania (61.6%), Valencia (64.0%) and Real Betis (64.5%).
Next Tuesday, the 59th issue of the Big-5 Weekly Post will present exclusive data from the 2014 edition of the CIES Football Observatory Demographic Study.
For more information please contact us at football.observatory@cies.ch
The best performing big-5 league players: Suárez, Ribéry, Verratti, Alaba and Chiellini
The rankings compare players according to key performance indicators exclusively developed by the CIES Football Observatory academic team using data provided by our partner Opta Pro. The indicators measure both the production and efficiency of players in six complementary areas of the game: shooting, chance creation, take on, distribution, recovery and rigour (see explanation below).
All the indicators are perfectly comparable at international level as they were developed by taking into account the differences between leagues in both the style of play and game intensity.
Luis Suárez outranks Cristiano Ronaldo (1st in Spain) and Neymar among the best performing strikers. In the remaining leagues, Carlos Tévez tops the table in Italy, Zlatan Ibrahimovi? in France and Marco Reus in Germany.
Franck Ribéry was the best performing offensive midfielder both in Germany and at big-5 league level, ahead of James Rodríguez (1st in France) and Miralem Pjani? (1st in Italy). In the other leagues, Samir Nasri tops the English table and Andrés Iniesta the Spanish one.
Paris St-Germain rising star Marco Verratti heads the ranking for central and defensive midifielders. The young Italian prodigy outperforms Gabi Fernández (1st in Spain) and Arturo Vidal (1st in Italy). Former full back Philipp Lahm ranks first in Germany, while Aaron Ramsey tops the English table.
Another very young player tops the table for full backs: David Alaba. In the other leagues, the best performing full backs were Douglas Maicon (Italy), Layvin Kurzawa (France), Pablo Zabaleta (England) and Dani Alves (Spain).
Finally, Giorgio Chiellini finishes top of the ranking for centre backs, ahead of Dante Bonfim (1st in Germany) and Leandro Castán. Alex da Silva heads the French table, Dejan Lovren the English one and Gerard Piqué was the best performing centre back in Spain.
More rankings are available in the 57th edition of the Big-5 Weekly Post. For more information, please contact us at football.observatory@cies.ch
CIES Football Observatory key performance indicators
Shooting: ability to take advantage of goal opportunities through accurate shooting
Chance creation: ability to create goal opportunities through efficient passing
Take on: ability to create dangerous situations by successfully challenging opponents
Distribution: ability to hold the grip on the game through efficient passing
Recovery: ability to minimise goal opportunities for opponents through proficient ball recovery
Rigour: ability to minimise goal opportunities for opponents by efficiently blocking their actions
Big-5 Weekly Post on U21 players
Our analysis shows that French Ligue 1 clubs fielded more U21 players since the start of the season than teams in the four other big-5 leagues. On average, a Ligue 1 club plays with 1.61 footballers aged 21 or under. This figure is also relatively high in Germany (1.52) and Spain (1.24). Conversely, the rate of employment of U21 players per club is lower than one in Italy (0.96) and England (0.74).
In the English Premier League, only six clubs fielded on average more than one U21 player per match: Southampton (2.0), Swansea (1.8), Everton (1.8), Liverpool (1.4), Arsenal (1.3) and Manchester United (1.2). At the opposite end of the table is Chelsea. Mourinho’s team has not yet fielded a single U21 players during the current season.
The highest number of U21 players fielded among current top ranked team was registered for Paris St-Germain (2.6), while the lowest was recorded for Barcelona (0.8). Atlético Madrid also fielded relatively more U21 players than the Catalan side (2.2). Does Gerardo Martino feel less confident in Barcelona’s cantera players than his predecessors?
The data for each big-5 league club is presented in the 56th Big-5 Weekly Post which is now available here.
For more information please email us at football.observatory@cies.ch
Best performing players in November
This edition focuses on the performance of big-5 league footballers from the start of November until games of the last matchday.
The most surprising result is the first position in the Italian general ranking of Omar El Kaddouri, a Belgian-Moroccan 23 year-old attacking midfielder loaned by Napoli to Torino.
At the second place is the 19 year-old Domenico Berardi who already greatly contributed to the promotion achieved by Sassuolo last season. He was signed by Juventus during last transfer window, but remained on loan at Sassuolo in order to gain experience.
Several players signed at the start of the season have adapted perfectly to their new work environment and are to be found in the top 3 positions of the general table in their respective league: Navas (1st in England), Isco (1st in Spain), Bale (2nd in Spain), Thauvin (2nd in France) and Son (2nd in Germany).
Based on data provided by our partner OptaPro, the CIES Football Observatory rankings take into account pitch productivity in five key areas of the game: shooting, chance creation, take on, distribution and recovery (see below for more details). By weighting each indicator according to the strength of its correlation with club results, we obtain a general index highlighting the most decisive footballers.
The rankings of the best performing players in the five major European championships per area of the game can be found in the Big-5 Weekly Post. This can now be downloaded from the CIES Football Observatory website.
Methodological note: specifications of indicators
- Shooting measures the effectiveness of players to shoot and score goals, excluding penalties
- Chance creation refers to the ability of players to put teammates into shooting positions, with particular emphasis on goal assists
- Take on highlights footballers who are both productive and efficient in dribbling, crossing and winning corners
- Distribution refers to the ability of players to make accurate passes, above all in the opposition half
- Recovery brings to the fore players whose tackling and interceptions minimise the chances for opponents to score goals and shoot, especially from close range
Big-5 Weekly Post on tall players
Our analysis shows great differences between Northern (England, Germany) and Southern (Italy, France, Spain) European leagues.
In Germany, clubs have employed so far 4.4 players taller than 185cm on average. This figure is only 2.0 in Spain.
All clubs fielded at least one player over 185cm in height. However, four teams play on average with less than a footballer taller than 185 cm (Celta Vigo, Real Valladolid, Valenciennes and Montpellier).
Conversely, four teams are on average made up of a majority of players taller than 185cm (Stoke City, Hamburg, Schalke 04 and Bayer Leverkusen).
Among current top ranked clubs, the lowest number of tall players was fielded by Barcelona (1.5 on average on the pitch), while the greatest was registered at Juventus (5.5).
The figures for all big-5 league clubs are available on the CIES Football Observatory website.
Updates added to CIES Football Observatory online database
All interested users can now actively consult and access the trends observed in each of the big-5 leagues in relation to the following indicators:
• Average age
• Average height
• % of club-trained players
• % of full internationals
• % of expatriates
• Average stay
(More detailed descriptions for each indicator are available on the Football Observatory website)
For more information please contact us at football.observatory@cies.ch
On another level, we are pleased to inform our European audience that the Football Research in Enlarged Europe (FREE) project has launched an online survey about what football means to Europeans in their daily lives. You are kindly invited to participate at this link
Football Observatory big-5 league predictions
Our predictions are based on the analysis of player profile data from the perspective of “experience” (number of matches played and results achieved), “prolificacy” (number of goals scored and level of the competition) and “stability” (number of seasons with the employer club and years remaining on contract).
Using these indicators, we have classified teams by taking into account the 11 players with the highest scores (potential “starting 11”), as well as squad members ranked between the 12th and 22nd positions (“substitutes”). The final ranking has been estimated on the basis of the average position in the two tables. In case of equality, we ranked teams according to their overall score.
Manchester United and Paris St-Germain are the only two most probable champions ranked in first position for both “starting 11” and “substitute” players. While the competitive advantage of Borussia Dortmund is mainly related to the 11 players with the highest scores, and that of Juventus is due to the quality of substitutes. The same holds true for Real Madrid with respect to Barcelona.
Monaco is the only promoted team with a real chance of finishing the season in the top three of their domestic league. Conversely, this year many prestigious teams risk being sucked into a fight against relegation (Fulham, Levante, Valenciennes, Werder Bremen, Torino, etc.).
Using the indicators described above, we were also able to identify the players with the highest scores, and whose performance levels should have the greatest impact on results obtained by their respective teams (key players).
The full predictions may be downloaded from the CIES Football Observatory website. We are at your disposal for more information at football.observatory@cies.ch
New record in big-5 league transfer expenditure
With xxx million euro invested for new players, English teams were the most active. It is the highest level ever recorded. A new record high was also measured in France (383 million euro) and Germany (259 million).
The transfer expenditure of the 10 clubs that spent the most account for 49.2% of fees paid. This figure is at an all-time high and reflects the growing concentration of wealth in top level football. The percentage of fees paid by the three most active clubs per league varies from 85.8% in France to 45.6% in England.
More information is presented in the issue 45 of the Big-5 Weekly Post. For further enquiries, please contact us at football.observatory@cies.ch
New Big-5 Weekly Post on transfer fees
The new edition of the Big-5 Weekly Post is now available here (issue 44).
The Post includes the 20 latest paying transfers concerning players who were employed by big-5 league teams during the second semester of the season 2012/13.
The CIES Football Observatory estimation takes into account a multitude of variables such as players’ pitch performances (notably the number of matches and goals), length of contract remaining, age, position and international experience.
More information is presented in the 2013 edition of our Annual Review. The publication is on sale in the online shop of the International Centre for Sports Studies.
Students, academics and journalists may ask for a discount by writing to football.observatory@cies.ch
Annual Review 2013: press review
The publication presents a comparative analysis of clubs and players in the big-5 European leagues at demographic, economic and pitch performance levels. An excerpt of the study is to be found on the Football Observatory’s website.
The Annual Review is on sale as a pdf on the CIES online shop. Journalists, students and academics may obtain a discount by writing to football.observatory@cies.ch. Please write to the same address for more information.
The CIES Football Observatory launches the 2013 Annual Review
The Annual Review notably reveals that Lionel Messi would largely break the 94-million euro transfer fee record. Estimated on the basis of an exclusive econometric model, his value is between 217 and 252 million euro. With an estimated value between 102 and 118 million, Cristiano Ronaldo would probably also break his own record.
At club level, the analysis shows that Barcelona holds the greatest assets from a player economic value perspective: 658 million euro. This figure is three times higher than that spent on signing the players used during the 2012/13 season. This reflects the extraordinary ability of the Catalan side to train, launch and add value to home-grown players.
Lionel Messi is not only the most expensive big-5 league player, but also the most decisive one for the 2012/13 season. The ranking is based on the performances for five key indicators: shooting, chance creation, take on, distribution and recovery. The Argentinean outranks Champions League winner Franck Ribéry and Cristiano Ronaldo.
The most decisive young player was Mario Götze. The new Bayern Munich signing is followed by two very promising Belgian footballers belonging to Chelsea: Kevin de Bruyne and Romelu Lukaku. They definitively both deserve to have a chance to play for the London club.
The performance analysis at club level shows that Bayern Munich’s fantastic season was the result of the unmatched balance between attack, distribution and defence. The Champions League winner tops the German Bundesliga rankings for the three key team performance indicators covered by our analysis: defensive solidity, grip on the game and attacking incisiveness. No other champion was able to do so.
The 2013 Annual Review also investigates the evolution in competitive balance within leagues since 2003/04. With the exception of Italy, point gaps between teams are on the increase. This trend is particularly marked in Spain and Germany. Over the last decade, the three most successful clubs achieved more than 60% of podium ranks in all the leagues, up to 80% in Spain and England (24 out of 30).
In 2012/13, money spent in transfer fees to sign first team players was highly correlated to club results in all the leagues. All the champions were among the three biggest spenders in their respective league. This confirms the strong influence of money on success.
Without new regulatory mechanisms to improve income distribution, competitive balance will be further jeopardised by the transformation of top level clubs into global brands, their regular participation in the increasingly lucrative Champions League and investments made by wealthy owners.
The Annual Review is on sale as a pdf on the CIES online shop. Journalists, students and academics may obtain a discount by writing to football.observatory@cies.ch. Please write to the same address for more information.
Big-5 league predictions: end of season assessment
Furthermore, two teams that we categorised as main outsiders for a podium finish also achieved this goal: Chelsea and Lyon. The remaining team which finished in the top three, Bayer Leverkusen, was forecast to finish 5th according to our model. Of the clubs that we expected to be classified on the podium, the worst result was obtained by Lille (6th), while Arsenal and Schalke 04 just missed this objective (4th).
Generally speaking, our objective was to have an average gap between ranking estimated and obtained of “lower than 4 in all the leagues”. This target was achieved with the following average ranking gaps: Italy 2.4, England 2.9, Germany 2.9, France 3.1 and Spain x.x.
The highest positive gaps per league between ranking achieved and estimated were measured for the following clubs: Nice (+11), Freiburg (+11), Rayo Vallecano and Betis Sevilla (+10), Norwich (+8) and Cagliari (+7). Conversely, the highest negative gaps were recorded for Mallorca (-10), Sunderland (-9), Brest (-8), Stuttgart (-8) and Sampdoria (-6).
With regard to the eventual league champions, it was impossible to do worse than the previous season (0 out of 5). This year we are pleased to have forecast four title winners (all except Manchester United). This is one more than in the previous record season (2010/11). However, the proportion for the three last seasons is still inferior to 50% (7 out of 15).
We are also pleased to announce that the eighth edition of the Annual Review will be published on the 13th of June. It will for the first time include an estimate of the economic value of big-5 league players according to a cutting-edge econometric model exclusively developed by the CIES Football Observatory academic team.
Ribéry best performing big-5 league player … after Messi
Based on data provided by our partner OptaPro, the CIES Football Observatory rankings take into account pitch productivity in five key areas of the game: shooting, chance creation, take on, distribution and recovery (see below for more details). By weighting each indicator according to the strength of its correlation with club results, we obtain a general index highlighting the most decisive footballers.
Rankings of the ten best performing players in the five major European championships can be found in the final Big-5 Weekly Post of the season. This can now be downloaded from the CIES Football Observatory website.
Barcelona players feature at the top of three rankings out of the five concerning the key areas of the game covered by our analysis: Messi for shooting, Iniesta for chance creation and Xavi for distribution. This demonstrates that the recent success of the Catalan side is not only due to great individual talent, but is also the result of optimal labour division and the distribution of complementary skills amongst their team. Ribéry was the most productive and efficient player for take on, while Chielllini tops the ranking for recovery.
An in-depth analysis of big-5 league clubs and players will be available in the forthcoming eighth edition of the CIES Football Observatory Annual Review. The new Review will be launched on the 13th June 2013. For the first time, this exclusive reference publication will present the economic value of big-5 league players using a new econometric model. This is based on the detailed analysis of the characteristics of nearly 1,000 players transferred for a fee by big-5 league clubs since 2009/10. The development of such a model marks a crucial step in the evolution of our research project.
For more information on our work and to pre-order the Annual Review, please write to football.observatory@cies.ch
Methodological note: specifications of indicators
Shooting measures the effectiveness of players to shoot and score goals, excluding penalties. Chance creation refers to the ability of players to put teammates into shooting positions, with particular emphasis on goal assists. Take on highlights footballers who are both productive and efficient in dribbling, crossing and winning corners. Distribution refers to the ability of players to make accurate passes, above all in the opposition half. Finally, recovery brings to the fore players whose tackling and interceptions minimise the chances for opponents to score goals and shoot, especially from close range.
Big-5 Weekly Post - Issue 37
 |
The CIES Football Observatory is pleased to inform you that a new edition of the Big-5 Weekly Post is available to download for free on our website. The latest issue considers the subject of footballers running out of their contracts. |
Leagues with the most / least percentage of minutes played by footballers running out of their contracts (last week-end)
Italian Serie A 27.6 / English Premier League 6.7
Clubs with the most percentage of minutes played by footballers running out of their contracts (last week-end
1. AC Siena (ITA) 71.2 - 2. Rayo Vallecano (ESP) 65.9 - 3. Pescara Calcio (ITA) 63.6
We are also pleased to present you the most productive players for each of the big-5 European leagues in last week-end matches.
Most productive players, general index (last week-end)
ENG: P. Coutinho (Liverpool)/ ESP: É. Banega (Valencia) / FRA: Brandao (Marseille) / GER: F. Ribéry (Bayern) / ITA: A. Ljaji? (Fiorentina)
The most productive players per area of the game also available on our website. Enjoy the read!
Big-5 Weekly Post - Issue 36
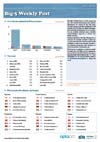 |
The CIES Football Observatory is pleased to inform you that a new edition of the Big-5 Weekly Post is available to download for free on our website. The latest issue considers the subject of African players (players who grew up in a African country and who went abroad following recruitment
by a club overseas). |
Leagues with the most / least percentage of minutes played by African players (last week-end)
French Ligue 1 13.2 / Italian Serie A 1.4
Clubs with the most percentage of minutes played by African players (last week-end
1. Stade Rennais FC (FRA) 35.5 - 2. Valenciennes FC, Lille OSC (FRA) 27.3
We are also pleased to present you the most productive players for each of the big-5 European leagues in last week-end matches.
Most productive players, general index (last week-end)
ENG: D. Sturridge (Liverpool)/ ESP: A. Guardado (Valencia) / FRA: R. Rodelin (Lille) / GER: F. Ribéry (Bayern) / ITA: A. Vidal (Juventus)
The most productive players per area of the game also available on our website. Enjoy the read!
Big-5 Weekly Post - Issue 35
 |
Dear Subscriber,
the CIES Football Observatory is pleased to inform you that the latest issue of the Big-5 Weekly Post is now available to download for free on our website. This issue presents the most productive players in the big-5 leagues during April. |
Thanks to the data provided by Opta Pro, our analysis concerns five key areas of the game: shooting, chance creation, take on, distribution, and recovery. The general index is the weighted sum of all these specific indicators. In April, the most productive players overall were:
- Daniel Sturridge (Liverpool FC) in England
- Alexis Sánchez (FC Barcelona) in Spain
- Rémy Cabella (Montpellier HSC) in France
- Claudio Pizarro (FC Bayern München) in Germany
- Fabrizio Miccoli (Palermo US) in Italy
Some players from middle or bottom ranked clubs also performed particularly well in specific areas of the game. For example, Andros Townsend (Queens Park Rangers FC) was the most productive player in take on for England and Thiago Xavier (ES Troyes) is at the top of the table in recovery in France.
The CIES Football Observatory academic team is at your disposal for more information.
Kind regards
Raffaele Poli, head of CIES Football Observatory
Big-5 Weekly Post - Issue 34
 |
The CIES Football Observatory is pleased to inform you that a new edition of the Big-5 Weekly Post is available to download for free on our website. The latest issue considers the subject of expatriate footballers under 21 years of age. |
Leagues with the most / least percentage of minutes played by U21 expatriate players (last week-end)
Italian Serie A 6.9 / Spanish Liga 0.9
Clubs with the most percentage of minutes played by U21 expatriate players (last week-end
1. TSG 1899 Hoffenheim (GER) 25.3 - 2. Sampdoria UC (ITA) 21.8 - 3. Bologna FC (ITA), Internazionale Milano FC (ITA), Hamburger SV (GER) 18.2
We are also pleased to present you the most productive players for each of the big-5 European leagues in last week-end matches.
Most productive players, general index (last week-end)
ENG: D. Sturridge (Liverpool)/ ESP: G. Castro (Real Sociedad) / FRA: S. Kalou (Lille) / GER: Diego (Wolfsburg) / ITA: P. Osvaldo (AS Roma)
The most productive players per area of the game also available on our website. Enjoy the read!
Big-5 Weekly Post - Issue 33
 |
The CIES Football Observatory is pleased to inform you that a new edition of the Big-5 Weekly Post is available to download for free on our website. The latest issue considers the subject of national footballers under 21 years of age. |
Leagues with the most / least percentage of minutes played by U21 national players (last week-end)
German Bundeliga 10.7 / English Premier League 0.7
Clubs with the most percentage of minutes played by U21 national players (last week-end
1. FC Schalke 04 (GER) 27.3 - 2. FSV Mainz 05 (GER) 25.3 - 3. SpVgg Greuther Fürth (GER) 24
We are also pleased to present you the most productive players for each of the big-5 European leagues in last week-end matches.
Most productive players, general index (last week-end)
ENG: L. Suárez (Liverpool)/ ESP: C. Ronaldo (Real Madrid) / FRA: T. Mangani (Nancy) / GER: C. Pizarro (Bayern) / ITA: D. De Rossi (AS Roma)
The most productive players per area of the game also available on our website. Enjoy the read!
Big-5 Weekly Post - Issue 32
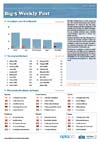 |
The CIES Football Observatory is pleased to inform you that a new edition of the Big-5 Weekly Post is available to download for free on our website. The latest issue considers the subject of footballers over 30 years of age. |
Leagues with the most / least percentage of players over 30 on the pitch (last week-end)
Italian Serie A 32.2 / German Bundeliga 18.4
Clubs with the most / least percentage of players over 30 on the pitch (last week-end
Atalanta Bergamo (ITA) 57,8 / Club Atlético de Madrid (ESP), Aston Villa FC (ENG), SV Werder Bremen (GER) 0
We are also pleased to present you the most productive players for each of the big-5 European leagues in last week-end matches.
Most productive players, general index (last week-end)
ENG: C. N’Zogbia (Aston Villa)/ ESP: T. Alcântara (Barcelona) / FRA: Y. Jouffre (Lorient) / GER: J. Blaszczykowski (Dortmund) / ITA: L. Muriel (Udinese)
The most productive players per area of the game also available on our website. Enjoy the read!
Big-5 Weekly Post - Issue 31
 |
The CIES Football Observatory is pleased to inform you that a new edition of the Big-5 Weekly Post is available to download for free on our website. The latest issue considers the subject of transfer fees spent for players fielded. |
Leagues with the most / least total sum of transfer fees spent for players fielded during last week-end (by club)
English Premier League 90.8 M°€ / French Ligue 1 19.9 M°€
Clubs with the most / least total sum of transfer fees spent for players fielded during last week-end
Real Madrid (ESP) 410.3 M°€ / Ajaccio, Bastia (FRA), Levante, Rayo Vallecano (ESP) 0 M°€
We are also pleased to present you the most productive players for each of the big-5 European leagues in last week-end matches.
Most productive players, general index (last week-end)
ENG: J. Rodriguez (Southampton)/ ESP: F. Fàbregas (Barcelona) / FRA: S. Kalou (Lille) / GER: J. Draxler (Schalke 04) / ITA: A. Di Natale (Udinese)
The most productive players per area of the game also available on our website. Enjoy the read!
Big-5 Weekly Post - Issue 30
 |
Dear Subscriber,
the CIES Football Observatory is pleased to inform you that the latest issue of the Big-5 Weekly Post is now available to download for free on our website. This issue presents the most productive players in the big-5 leagues during March. |
Thanks to the data provided by Opta Pro, our analysis concerns five key areas of the game: shooting, chance creation, take on, distribution, and recovery. The general index is the weighted sum of all these specific indicators. In March, the most productive players overall were:
- Wayne Rooney (Manchester United FC) in England
- Lionel Messi (FC Barcelona) in Spain
- Yohan Mollo (AS St-Etienne) in France
- Philipp Lahm (FC Bayern München) in Germany
- Rodrigo Palacio (Internazionale Milano FC) in Italy
Some players from middle or bottom ranked clubs also performed particularly well in specific areas of the game. For example, Antolín Alcáraz
(Wigan Athletic FC) was the most productive player in recovery for England and Roberto Trashorras (Rayo Vallecano de Madrid) is at the top of the table in distribution in Spain.
The CIES Football Observatory academic team is at your disposal for more information.
Kind regards
Raffaele Poli, head of CIES Football Observatory
New paper on financial inequalities and squad make-up
The paper is available to download for free here. footballperspectives.org brings together research - or experienced-based contributions - from academics studying the game and from people working within it on issues affecting football today.
Driven from data collected within the context of the latest Demographic Study, the CIES paper shows the impact of financial inequalities on squad make-up throughout Europe.
The authors notably report that “the proportion of full internationals drops from 46% for big-5 clubs to 15% for fourth echelon leagues”. At club level, during the first semester of the current season Manchester City FC has fielded 24 full internationals, the highest figure in Europe. Manchester City is also the team employing the highest number of players with international caps in 2012 (19).
These figures raise the issues of player hoarding and competitive balance in European football. This is a growing problem which will be addressed in the 2013 edition of the CIES Football Observatory Annual Review to be published next June - shortly after the end of the five major championships.
The full Demographic Study and other publications of the CIES Football Observatory may be purchased here.
Big-5 Weekly Post - Issue 29
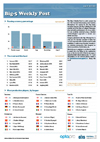 |
The CIES Football Observatory is pleased to inform you that a new edition of the Big-5 Weekly Post is available to download for free on our website. The latest issue considers the subject of passing accuracy. |
Leagues with the most / least passing accuracy percentage during last week-end
English Premier League 76.9 / French Ligue 1 73.9
Clubs with the most / least passing accuracy percentage
Swansea City AFC (ENG) 86.57 / FC Augsburg (GER) 54.12
We are also pleased to present you the most productive players for each of the big-5 European leagues in last week-end matches.
Most productive players, general index (last week-end)
ENG: E. Hazard (Chelsea)/ ESP: L. Messi (Barcelona) / FRA: R. Boudebouz (Sochaux) / GER: N. Sahin (Dortmund) / ITA: G. Pandev (Napoli)
The most productive players per area of the game also available on our website. Enjoy the read!
Big-5 Weekly Post - Issue 28
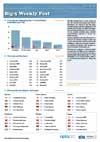 |
The CIES Football Observatory is pleased to inform you that a new edition of the Big-5 Weekly Post is available to download for free on our website. The latest issue considers the subject of percentage of minutes played by the 11 most fielded footballers per club. |
Leagues with the most / least % of minutes played by the 11 most fielded footballers per club
German Bundesliga 76.6 / Italian Serie A 71.5
Clubs with the most / least % of minutes played by the 11 most fielded footballers
Eintracht Frankfurt (GER) 87.4 / Pescara Calcio (ITA) 59.7
We are also pleased to present you the most productive players for each of the big-5 European leagues in last week-end matches.
Most productive players, general index (last week-end)
ENG: A. Townsend (QPR)/ ESP: D. Alves (Barcelona) / FRA: Y. Mollo (St-Etienne) / GER: P. Lahm (Bayern) / ITA: A. Carvalho (Parma)
The most productive players per area of the game also available on our website. Enjoy the read!
Big-5 Weekly Post - Issue 27
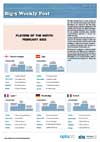 |
Dear Subscriber,
the CIES Football Observatory is pleased to inform you that the latest issue of the Big-5 Weekly Post is now available to download for free on our website. This issue presents the most productive players in the big-5 leagues during February. |
Thanks to the data provided by Opta Pro, our analysis concerns five key areas of the game: shooting, chance creation, take on, distribution, and recovery. The general index is the weighted sum of all these specific indicators. In February, the most productive players overall were:
- Santi Cazorla (Arsenal FC) in England
- Cristiano Ronaldo (Real Madrid) in Spain
- Dimitri Payet (Lille OSC) in France
- Ibrahima Traoré (VfB Stuttgart) in Germany
- Stevan Joveti? (AC Fiorentina) in Italy
Some players from middle or bottom ranked clubs also performed particularly well in specific areas of the game. For example, Florian Thauvin (Bastia SC) was the most productive player in take on for France and Matteo Rubin (AC Siena) is at the top of the table in chance creation in Italy.
The CIES Football Observatory academic team is at your disposal for more information.
Kind regards
Raffaele Poli, head of CIES Football Observatory
Big-5 Weekly Post - Issue 26
 |
The CIES Football Observatory is pleased to inform you that a new edition of the Big-5 Weekly Post is available to download for free on our website. The latest issue considers the subject of Big-5 Experience (average number of big-5 league matches since the start of the player’s career). |
Leagues with the most / least experienced players (last week-end)
English Premier League 138.6 / German Bundesliga 94.9
Clubs with the most / least experienced players (last week-end)
Manchester United (ENG) 258.7 / SpVgg Greuther Fürth (GER) 20.4
We are also pleased to present you the most productive players for each of the big-5 European leagues in last week-end matches.
Most productive players, general index (last week-end)
ENG: S. Cazorla (Arsenal)/ ESP: Beñat (Betis) / FRA: D. Payet (Lille) / GER: A. Robben (Bayern) / ITA: D. Conti (Cagliari)
The most productive players per area of the game also available on our website. Enjoy the read!
Big-5 Weekly Post - Issue 25
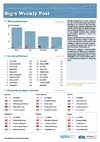 |
The CIES Football Observatory is pleased to inform you that a new edition of the Big-5 Weekly Post is available to download for free on our website. The latest issue considers the subject of non-european players (expatriates players who originate from a non-UEFA country). |
Leagues with the most / least non-european players (percentage of minutes played by non-european players during last week-end)
Italian Serie A 29.3% / French Ligue 1 16.1%
Clubs with the most / least non-european players (last week-end)
Calcio Catania (ITA) 68.9% / Stade Brestois (FRA), Bayer 04 Leverkusen (GER) and Athletic Club Bilbao (ESP) 0.0%
We are also pleased to present you the most productive players for each of the big-5 European leagues in last week-end matches.
Most productive players, general index (last week-end)
ENG: not available / ESP: A. Colunga (Getafe) / FRA: J. Cavalli (Ajaccio) / GER: M. Reus (Dortmund) / ITA: S. Joveti? (Fiorentina)
The most productive players per area of the game also available on our website. Enjoy the read!
Big-5 Weekly Post - Issue 24
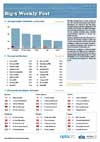 |
The CIES Football Observatory is pleased to inform you that a new edition of the Big-5 Weekly Post is available to download for free on our website. The latest issue considers the subject of average height of defenders. |
Leagues with the tallest / shortest defenders (average height of defenders on the pitch during last week-end)
German Bundesliga 185.6 cm / French Ligue 1 182.2 cm
Clubs with the tallest / shortest defenders (last week-end)
Fulham FC (ENG) 190.7 cm / SC Bastia (FRA) 175.6 cm
We are also pleased to present you the most productive players for each of the big-5 European leagues in last week-end matches.
Most productive players, general index (last week-end)
ENG: Michu (Swansea) / ESP: C. Ronaldo (Real Madrid) / FRA: R. Cohade (St-Etienne) / GER: S. Kiessling (Leverkusen) / ITA: E. Lamela (AS Roma)
The most productive players per area of the game also available on our website. Enjoy the read!
New Big-5 Weeekly Post
This edition presents the most productive players for the month of January using the exclusive data provided by our partner OptaPro. If you do not receive our weekly alerts about the Post, please reply to this email and we will include your address also in this specific mailing list.
We also remind you that you may download a free excerpt of the newly published Demographic Study 2013. You find a selection of papers published on the report here.
The complete Study is on sale at this address. Please reply to this email to take advantage of the educational discount. We stay at your disposal for more information.
Brand new Demographic Study available
As Dr Raffaele Poli, head of the CIES Football Observatory, explains, “the percentage of players imported from abroad at European level has never been as high as in the current season. Of the top 31 division leagues of UEFA member associations we surveyed, 36.1% of all squad members grew up in a different national association to that of their employer club.”
The new and fully illustrated report identifies that expatriate footballers represent more than one quarter of players in all positions, with a record high of 44.3% among forwards. Their percentage is above 50% in six championships out of the 31 surveyed (Cyprus, England, Portugal, Belgium, Italy and Turkey). The level observed in the top Cypriot league is the highest ever recorded (74.2%).
Brazil remains by far the top exporting country. However, the overall number of Brazilians has fallen slightly during the last year, from 524 to 515. Conversely, expatriates from the second most represented origin, France, have significantly increased from 245 to 269. The highest increase overall was measured for Spanish (+34 to 148) and Portuguese players (+41 to 171).
During the last year, the highest growth was recorded in Bulgaria (+6.9%) and the Ukraine (+6.2%). At the opposite end of the table is Greece, where economic turmoil has provoked a fall in the rate of expatriates (-14.9%). The latter now represents less than one fifth of squad members only in three championships (Slovenia, Serbia and Croatia) out of the 31 reviewed.
The rise in the relative presence of expatriates goes hand in hand with the shrinking of club-trained footballers. Their percentage at European level reached a record low in the current season of 21.1%. Since 2009, the percentage of home-grown footballers diminished throughout the continent except in Central Europe. It is now lower than 10% in Portugal, Turkey and Italy.
The latest Football Observatory study also includes comprehensive club level data. For example, the Barcelona squad contains the smallest players (177.74 cm on average). In addition, the Catalan side is made up of the players who have been together for longest in the first team squad, with 5 years the average. Two other Champions League possible winners are among the most stable teams: Shakhtar Donetsk (4.4 years, 3rd position) and Manchester United FC (4.3 years, 7th).
To download an excerpt of the Study, please click here
To buy the publication, click here
For more information and to ask for educational discount, please write to football.observatory@cies.ch
Big-5 Weekly Post - Issue 22
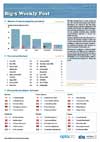 |
The CIES Football Observatory is pleased to inform you that a new edition of the Big-5 Weekly Post is available to download for free on our website. The latest issue considers the subject of minutes played by substitutes. |
Leagues with the most / least substitutes on the pitch (average of minutes played by substitutes per match during last week-end)
Italian Serie A 76.2 min. / English Premier League 47.2 min.
Clubs with the most / least substitutes on the pitch (last week-end)
AC Siena (ITA) 116 min. / SC Freiburg (GER) 2 min.
We are also pleased to present you the most productive players for each of the big-5 European leagues in last week-end matches.
Most productive players, general index (last week-end)
ENG: S. Cazorla (Arsenal) / ESP: C. Ronaldo (Real Madrid) / FRA: J. Morel (Marseille) / GER: S. Kiessling (Leverkusen) / ITA: S. El Shaarawy (Milan AC)
The most productive players per area of the game also available on our website. Enjoy the read!
Due to the winter break of the German Bundesliga, this is the last Big-5 Weekly Post of the year. Season greetings and until January 21st 2013!
Big-5 Weekly Post - Issue 21
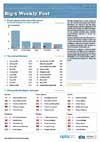 |
The CIES Football Observatory is pleased to inform you that a new edition of the Big-5 Weekly Post is available to download for free on our website. The latest issue considers the subject of new signings (players signed at the start of the season, not including players from youth academies). |
Leagues with the most / least new signings (percentage of minutes played by new signings during last week-end)
Italian Serie A 40.1% / Spanish Ligua 21.3%
Clubs with the most / least new signings (last week-end)
AC Fiorentina 81.8% / Girondins de Bordeaux (FRA), VfB Stuttgart
(GER) 0.0%
We are also pleased to present you the most productive players for each of the big-5 European leagues in last week-end matches.
Most productive players, general index (last week-end)
ENG: J. de Guzmán (Swansea) / ESP: J. Saviola (Málaga) / FRA: Y. Mollo (Nancy) / GER: M. Feulnerl (Nürnberg) / ITA: F. Totti (AS Roma)
The most productive players per area of the game also available on our website. Enjoy the read!
Big-5 league players of the month
 |
Dear Subscriber,
the CIES Football Observatory is pleased to inform you that the latest issue of the Big-5 Weekly Post is now available to download for free on our website. This issue presents the most productive players in the big-5 leagues during November. |
Thanks to the data provided by Opta Pro, our analysis concerns five key areas of the game: shooting, chance creation, take on, distribution, and recovery. The general index is the weighted sum of all these specific indicators. In November, the most productive players overall were:
- Theo Walcott (Arsenal FC) in England
- Andrés Iniesta (FC Barcelona) in Spain
- Foued Kadir (Valenciennes FC) in France
- Mario Götze (Borussia Dortmund) in Germany
- Stephan El Shaarawy (AC Milan) in Italy
Some players from middle or bottom ranked clubs also performed particularly well in specific areas of the game. For example, Adel Taarabt (Queens Park Rangers) was the most productive player in take on for England and Marco Estrada (Montpellier HSC) is at the top of the table in distribution in France.
The CIES Football Observatory academic team is at your disposal for more information.
Kind regards
Raffaele Poli, head of CIES Football Observatory
Big-5 Weekly Post - Issue 19
 |
The CIES Football Observatory is pleased to inform you that a new edition of the Big-5 Weekly Post is available to download for free on our website. The latest issue considers the subject of expatriate players (footballers who play outside of the national association in which they grew up, from where they departed following recruitment by a foreign club). |
Leagues with the most / least expatriates (percentage of minutes played by expatriates during last week-end)
English Premier League 61.4% / French Ligue 1 27.0%
Clubs with the most / least expatriates (last week-end)
Fulham FC 91.9% / Athletic Bilbao (ESP) 0.0%
We are also pleased to present you the most productive players for each of the big-5 European leagues in last week-end matches.
Most productive players, general index (last week-end)
ENG: J. Gómez (Wigan) / ESP: A. Iniesta (Barcelona) / FRA: W. Ben Yedder (Toulouse) / GER: J. Rosenthal (Freiburg) / ITA: F. Brienza (Palermo)
The most productive players per area of the game also available on our website. Enjoy the read!
Big-5 Weekly Post Issue 18
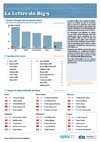 |
The CIES Football Observatory is pleased to inform you that a new edition of the Big-5 Weekly Post is available to download for free on our website. The latest issue considers the subject of the players changed in the starting eleven (compared to the previous championship match). |
Leagues with the most / least players changed (percentage of players changed in the starting eleven compared to the previous championship match)
Spanish Liga 30.0% / GermanBundesliga 19.7%
Club with the most changes (last week-end)
Bayern München (GER) 6 players
We are also pleased to present you the most productive players for each of the big-5 European leagues in last week-end matches.
Most productive players, general index (last week-end)
ENG: L. Suárez (Liverpool) / ESP: J. Reyes (Sevilla) / FRA: Y. Mollo (Nancy) / GER: M. Götze (Dortmund) / ITA: A. Cassano (Internazionale)
The most productive players per area of the game also available on our website. Enjoy the read!
Big-5 Weekly Post - Issue 17
 |
The CIES Football Observatory is pleased to inform you that a new edition of the Big-5 Weekly Post is available to download for free on our website. The latest issue considers the subject of club-trained players (footballers having played during at least three seasons between the ages of 15 and 21 for their current club). |
Leagues with the most / least club-trained players (percentage of minutes played by club-trained players during last week-end)
Spanish Liga 24.5% / Italian Serie A 6.4%
Clubs with the most club-trained players (last week-end)
Athletic Bilbao (ESP) 65.9%, Real Sociedad (ESP) 64.6%
We are also pleased to present you the most productive players for each of the big-5 European leagues in last week-end matches.
Most productive players, general index (last week-end)
ENG: M. Fellaini (Everton) / ESP: V. Rodríguez (Zaragoza) / FRA: S. Diarra (Ajaccio) / GER: H. Kiyotake (Nürnberg) / ITA: F. Quagliarella (Juventus)
The most productive players per area of the game also available on our website. Enjoy the read!
Big-5 Weekly Post - Issue 16
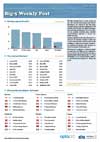 |
The CIES Football Observatory is pleased to inform you that a new edition of the Big-5 Weekly Post is available to download for free on our website. The latest issue considers the subject of full internationals (percentage of footballers who played at least one national A-team match during their career). |
Leagues with the most / least full internationals (percentage of minutes played by full internationals during last week-end)
English Premier League 74.1% / French Ligue 1 42.2%
Clubs with the most / least full internationals (last week-end)
Internazionale FC & Juventus FC (ITA) 100% / CA Osasuna (ESP) 1.8%
We are also pleased to present you the most productive players for each of the big-5 European leagues in last week-end matches.
Most productive players, general index (last week-end)
ENG: L. Suárez (Liverpool) / ESP: D. Villa (Barcelona) / FRA: F. Kadir (Valenciennes) / GER: T. Kroos (Bayern) / ITA: A. Gómez (Catania)
The most productive players per area of the game also available on our website. Enjoy the read!
Big-5 league players of the month
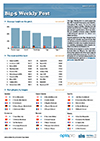 |
Dear Subscriber,
the CIES Football Observatory is pleased to inform you that the latest issue of the Big-5 Weekly Post is now available to download for free on our website. This issue presents the most productive players in the big-5 leagues during October. |
Thanks to the data provided by Opta Pro, our analysis concerns five key areas of the game: shooting, chance creation, take on, distribution, and recovery. The general index is the weighted sum of all these specific indicators. In October, the most productive players overall were:
- Juan Mata (Chelsea FC) in England
- Cesc Fàbregas (FC Barcelona) in Spain
- Alain Traoré (FC Lorient) in France
- Franck Ribéry (Bayern Munich) in Germany
- Eric Lamela (AS Roma) in Italy
Some players from middle or bottom ranked clubs also performed particularly well in specific areas of the game. For example, Wes Hoolahan (Norwich City) was the most productive player in take on for England and Papakouli Diop (Levante) is at the top of the table in recovery in Spain.
The CIES Football Observatory academic team is at your disposal for more information.
Kind regards
Raffaele Poli, head of CIES Football Observatory
The CIES Football Observatory discloses its 2012/13 big-5 league predictions
A brand new model has been developed which includes four main criteria for league success: international activity of players, their league experience, squad stability and the quality of signings. This latter factor was not included in models used for the two previous seasons.
The combination of all these elements suggests that the following clubs have the best chances of finishing in the top three positions of the rankings. Clubs in bold have the highest probability of winning their respective league.
England:
Manchester City, Manchester United, Arsenal
Spain:
Barcelona, Real Madrid, Atlético Madrid
Germany:
Bayern Munich, Borussia Dortmund, Schalke 04
Italy:
Juventus, Milan, Napoli
France:
Paris St-Germain, Lille, Olympique de Marseille
Our predictions also distinguish between clubs expected to finish in the top half of the league and teams expected to finish in the bottom part of the table. For both groups, we have identified a club per league with a high probability of performing better than expected, such as whether to finish in the top three (Chelsea, Valencia, Stuttgart, Inter Milan, and Olympique Lyonnais) or in the top half (West Bromwich, Getafe, Hamburger SV, Parma, and Lorient).
The complete predictions are available to download for free on the CIES Football Observatory website.
Week by week throughout the season, you will find on our website the updated comparison between the rank expected and actually achieved by all clubs as well as the average rank gap for each league. The best results last season were recorded in Italy and Germany (on average 3.2 ranks of difference between predictions and reality), while the worst was registered in Spain (4.3). The goal for this year is to have an average gap lower than 4 in all the leagues.
We kindly invite you to send us your questions, remarks or suggestions at football.observatory@cies.ch. We wish you an enjoyable season and, of course, may your favourite team perform better than we have forecasted!
The CIES Football Observatory and OptaPro strengthen their collaboration
Our first paper is already accessible by clicking here. It deals with the issue of player turnover at big-five league level, by comparing strategies followed by clubs according to their results for last season. This allows us to highlight best practices in this area.
More in-depth findings on this subject and further analysis on the key success factors both from a squad make up and pitch performance perspective will be published mid-August in the seventh edition of the CIES Football Observatory Annual Review.
The specific section on player pitch performance is already available by pre-ordering the full study. For more information, please refer to our website or write to football.observatory@cies.ch.
Gain a first glimpse of the 2012 Annual Review
The “Player pitch Performance” chapter allows interested parties to access essential information prior to the opening of the summer transfer window. It notably includes rankings which highlight the best performing footballers when compared to their team-mates. This data is particularly useful in identifying relatively unknown players as potential future signings.
The CIES Football Observatory Annual Review is a 96-page must-have publication for understanding the logics of success in the five major European leagues. Using a novel “demo-technic” approach, the CIES Football Observatory academic team carefully combine the study of players’ demographic profile with their on-pitch performances both at an individual and collective level.
The six chapters that make up this key reference publication cover the following areas: player selection and turnover; age structure and club experience; mobility and contracts; club pitch performance and player pitch performance. An excerpt of the last year report may be downloaded for free from our website.
To order or for further information, please contact us at: football.observatory@cies.ch
Papers from the CIES Football Observatory
An article (in French) presenting Euro 2012 teams’ strength is to be found at the following address.
The Football Observatory also publishes daily statistics on the Swiss radio and television’s -Radio Télévision Suisse (RTS)- official website.
Other recently published articles are accessible on the web: Football Analytics and Successful Recruitment and Understanding European Football.
Messi named CIES Football Observatory big-5 league player of the season
CIES Football Observatory’s rankings classify players according to their pitch productivity per minute played in the following areas of the game: shooting, chance creation, take on, distribution and recovery. For the general index, each indicator was weighted according to the strength of the correlation with points achieved by clubs at the end of the season.
Aggregated at team level, all of the Football Observatory indicators are significantly correlated to club results for all leagues and seasons. This ensures their relevance and objectivity. Player pitch statistics are provided by our partner company Opta.
Other big-5 league gold medal winners for the 2011-2012 season are as follows:
Cristiano Ronaldo (Real Madrid CF) for shooting
Mesut Özil (Real Madrid CF) for chance creation
Franck Ribéry (FC Bayern München) for take on
Xavi Hernández (FC Barcelona) for distribution
Arturo Vidal (Juventus FC) for recovery
At league level, the Most Productive Players (general index) were as follows:
Lionel Messi (Spain)
David Silva (England)
Andrea Pirlo (Italy)
Franck Ribéry (Germany)
Anderson Nenê (France)
Lionel Messi is also the Football Observatory’s most decorated player of the season. In total, he achieves two gold, three silver and one bronze medal. Other multi award winners are Franck Ribéry, Andrea Pirlo, Cristiano Ronaldo, Xavi Hernández and Mathieu Valbuena (4 medals each).
The complete list of the CIES Football Observatory medal winners can be found in the special edition of our Big-5 Weekly Post, which is available for free download on our website.
Annual Review pre-ordering
Further analysis will be presented in August, when the CIES Football Observatory will publish the 7th edition of its Annual Review. The electronic version of the specific section on player performance will be already available by mid-June. This will allow interested parties accessing this essential information prior to the opening of the summer transfer window.
The player performance section notably includes rankings which highlight the best performing footballers when compared to their team-mates. This is particularly useful to identify relatively unknown potential signings. The whole section can be obtained by pre-ordering the full CIES Football Observatory’s Annual Review at a cost of ?299 + postage.
To order or for further information, please contact us at: ootball.observatory@cies.ch
Big-5 league season predictions: a contrasting picture
Champions
Contrary to 2010/11, when three out of the five champions were correctly forecast, this ratio was 0% for the 2011/12 season. However, the final appraisal is not completely negative. Indeed, three forecasted champions finished 2nd (Barcelona, Bayern Munich and Paris St Germain). From the expected champions, the true disappointments came from Inter Milan (6th) and Champions League winner Chelsea FC (6th).
Moreover, three league champions out of five belonged to a narrow circle of “three-star” teams, for which our model had detected a concrete possibility of winning the title (Manchester City, Real Madrid and Borussia Dortmund). Another league winner, Juventus FC, was also forecast to finish on the podium (3th place), while the remaining one, Montpellier HSC, was indicated as a possible surprise team.
Top Three
Our model forecast 10 of the 15 teams that finished the season on the podium in their respective championship. Moreover, two out of the five remaining teams are among those whose quality of play during the two preceding seasons convinced us to classify them as possible surprise teams: Montpellier and Arsenal. This confirms the relevance of pitch performance indicators developed by the CIES Football Observatory on the basis of data provided by our partner company Opta.
Ultimately, only Schalke 04, Valencia CF and Udinese Calcio have confounded our predictions by finishing third. With the exception of Chelsea FC and Inter FC, no team that was predicted to finish on the podium finished lower than fifth place (Olympique Lyonnais 4th, Málaga CF 4th, Bayer Leverkusen 5th).
Most positive and negative gaps
The most positive negative gap between rank estimated and finally achieved was for the Spanish side Villarreal CF (-13 ranks compared to our prediction), followed by three other “two-star” teams that could not avoid relegation: AJ Auxerre (-12), Bolton Wanderers (-9) and Wolverhampton Wanderers (-9).
Conversely, the most positive gaps were for “one-star” teams Levante UD (+13 ranks compared to our prediction), Borussia Mönchengladbach (+11), FC Parma (+11, which was considered as a possible surprise team) and Newcastle United (+10).
For more information, click here
Conclusion
From a prediction perspective, this appraisal shows that the statistical analysis of the demographic profile of teams at the start of the season provides valuable projections. However, it also indicates that numerous other factors, some of which are impossible to forecast and measure, should be taken into account to help determine more accurately winning teams.
While aware of the evident limits of the purely statistical procedures followed, we will continue working to improve our models – and continue to enjoy the project as we follow and analyse this fascinating game!
Big-5 Weekly Post - Issue 10
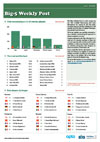 |
The CIES Football Observatory is pleased to inform you that a new edition of the Big-5 Weekly Post is available to download for free on our website. The latest issue considers the subject of big-5 league experience (average number of matches in the big-5 during career for players fielded). |
Highest / lowest big-5 league experience, per league (last week-end)
English Premier League 143 / Spanish Liga 115
Highest / lowest big-5 league experience, per club (last week-end)
Milan AC (ITA) 285 / Norwich City (ENG) 24
Best players, general index (last week-end)
ENG: Y. Touré (Man. City) / ESP: A. Cejudo (Osasuna) / FRA: Nenê (Paris St. Germain) / ITA: C. Seedorf (Milan AC)
Champions League Final 2012 – The Identikit of the Finalists
Chelsea FC, who lost in the 2008 final to Manchester United on penalties, and Bayern Munich, who were defeated by Inter Milan in 2010, will return to the biggest stage in club football for what will be a fascinating encounter. Both teams include numerous players who have participated in previous finals and both teams have battled against the odds to reach this stage of the tournament.
The CIES Football Observatory has analysed the two teams and can now present an exclusive identikit using three demographic and three technical indicators which are mainly linked to results. Each indicator is presented comparatively with the value of 100 for the team with the highest score. Our calculations are made on the basis of all matches played this year in the Champions League. Pitch performance indicators have been developed using data supplied by our partners Opta.
Chelsea FC shows greater Champions League experience and squad stability. However, this contrasts with Bayern Munich’s greater pitch performance levels in all areas of the game (attacking, distribution and defending) and recent national A-team activity for its squad members.
Our data indicate that Bayern Munich should win the final. The German side has also the advantage to playing at their home stadium. Interestingly, however, in 1984 AS Roma had also the opportunity to become champions at home but was defeated by Liverpool FC. It should be noted, though, that the last time the Champions League final was played in Munich a German club did win the competition with Borussia Dortmund the winners in 1997.
The today Big-5 Weekly Post is also available. Sign up to receive our e-news and periodic alerts from the home page (bottom left) of our website.
Big-5 Weekly Post - Issue 8
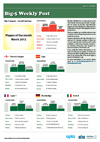 |
The latest issue of the Big-5 Weekly Post presents data on the best performing footballers for April in each of the five major European championships. All the results are available to download for free from the CIES Football Observatory website. |
Rankings are established according to five exclusive key performance indicators identified by the CIES Football Observatory on the basis of raw data provided by our partner company Opta. The indicators cover the following areas of play: open play shot, chance creation, take on, distribution and recovery.
Significantly, all of the indicators aggregated at team level are positively correlated to club results for each league and season. Only footballers who have played at least 50% of championship minutes in April are included in the rankings.
Best players, general index (April)
Big-5: L. Messi (Barcelona) / ENG: C. Tévez (Man. City) / ESP: L. Messi (Barcelona) / FRA: A. Traoré (Auxerre) / GER: I. Periši? (B. Dortmund) / ITA: A. Pirlo (Juventus)
New web address for the CIES Football Observatory
The address eurofootplayers.org is now redirected to this domain. This change reflects the recent and ongoing diversification of activities beyond football within the context of the broader CIES Observatory project.
The official launching of the latter will take place on the 2nd of May at the headquarters of the International Centre for Sports Studies (CIES) in Neuchâtel. On this occasion, the first ever International Basketball Migration Report will be presented.
Football lovers can rest assured as the Football section of the CIES Observatory will keep on growing and the contents of the website football-observatory.com will also be continuously developed in the weeks, months and years to come!
CIES Football Observatory predictions for the Champions League semi-finals
It should be noted, however, that only a small gap in pitch performance has been recorded by the Observatory for both fixtures and that the results in the two semi-finals are far from certain. As the exclusive Football Observatory performance indicators reveal, the general team productivity of FC Barcelona is only 11.1% greater than that of Chelsea FC, with the latter team showing significantly greater defensive strengths.
The other semi-final between Real Madrid and Bayern Munich is even more delicately balanced with the productivity of the Spanish side only 1.1% greater than that of the high flying German team. As Dr Raffaele Poli, Head of the CIES Football Observatory, notes, “This particular fixture is more likely to be decided by unpredictable events such as the injury to a key player, on pitch errors or various refereeing decisions.”
For more detailed statistics and analysis, please visit the CIES Football Observatory website or email us at eurofootplayers@cies.ch
If you would like to receive our weekly email alerts concerning the Big-5 Weekly Post, we kindly invite you filling in the registration form at the bottom left of the home page of our website.
You can also follow the CIES on twitter at: www.twitter.com/sportCIES
CIES Football Observatory predictions for the Champions League quarter finals
According to our general performance measurement index from the Champions League group stage, the only surprising outcome of the round of 16 was the elimination of French side Olympique Lyonnais by APOEL Nicosia.
The application of the same methodology for the forthcoming quarter finals suggests that the most evenly balanced fixture is that between FC Bayern München and Olympique de Marseille. Indeed, the general team productivity of the former club is only 13.7% greater than that of the latter one. The performance gap is 20.9% between Chelsea FC and SL Benfica, 21.6% between FC Barcelona and Milan AC, and up to 43.6% between Real Madrid and APOEL Nicosia.
More detailed statistics and analysis can be found on the CIES Football Observatory website at www.eurofootplayers.org
For immediate release
Neuchâtel, February 27th 2012
The CIES Football Observatory has today published a new study of football agent activity in Europe. The detailed report reveals that the yearly turnover for football intermediaries in UEFA member national associations is around 400 million €. The study also highlights the great level of concentration in the player representation market: half of the big-5 league footballers are represented by 83 football agents or agencies.
Other key findings concern the demographic profile of licensed agents domiciled in the five biggest European football markets: England, Italy, Spain, Germany and France. A questionnaire survey carried out by the authors of the study, Raffaele Poli and Giambattista Rossi, shows that agents are on average aged 42. Only 3.4% of them are female.
Almost three quarters of agents hold a university degree, and 71% of them speak a foreign language at intermediary or above. Only 41% of licensed agents carry out the job full-time. The majority operate in other business sectors - primarily law and finance.
The study also shows that a minority of agents (46%) support their clients in personal care activities such as finding a house or flat, organize travel, helping family members, etc. This result shows that the general view of agents “baby-sitting” their protégés does not correspond with reality. The former are above all busy in “spinning webs” and brokering deals.
Only 42% of the players represented by the respondents of the survey are senior professionals. This indicates that most of the agents are mainly active in the search for young talent, in the hope of making money in the future. While promising players can also take advantage of this situation, the pressure that intermediaries may exert on them is a controversial issue.
The research also shows that collaboration between intermediaries is also a key aspect of the profession. Half of the agents directly represent players on behalf of colleagues. The main reason to enter into such partnerships is to introduce a player client into a specific national market. This reveals the crucial role played by agents for the setting up of transnational networks at a global level.
Sporting directors are clearly indicated as the most important business partners when placing players, followed by football managers. Almost 40% of agents have already represented at least one coach since starting their career.
The great proportion of agents who manage the careers of both players and managers raises the question of conflicts of interest in the representation and transfer market.
The importance of this problem is even greater considering that more than 70% of respondents also assist clubs in buying, selling or scouting players. Moreover, 15% of licensed agents admitted owning or having owned shares in players’ transfer rights. All these figures reflect the existence of intricate situations and possible conflicts of interest. The report authors are now calling for more transparency.
The full 82-page report may be downloaded for free from the CIES Football Observatory website on www.eurofootplayers.org/-Publications
For more information, please contact the authors at eurofootplayers@unine.ch
Plus